Winsorization
Last Updated :
30 May, 2021
Winsorization is the process of replacing the extreme values of statistical data in order to limit the effect of the outliers on the calculations or the results obtained by using that data. The mean value calculated after such replacement of the extreme values is called winsorized mean.
For example, 90% winsorization means the replacement of the top 5% and bottom 5% of the data. The top 5% of the data is replaced by the value of the data at the 95th percentile and the value of the bottom 5% of the data is replaced by the value of the data at the 5th percentile.
Input:
- A numeric array whose values at the upper end and the lower end are to be winsorized.
- The first argument of the tuple is the percentage of values at the lower end which are to be winsorized.
- The second argument of the tuple is the percentage of values at the upper end which are to be winsorized.
Output:
A numeric array whose values at the upper end and at the lower end are winsorized as defined by the user.
Example #1:
Python3
import numpy as np
import matplotlib.pyplot as plt
import random
from scipy.stats.mstats import winsorize
|
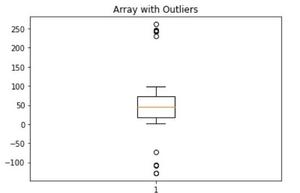
Let us see an example where outliers are present on both the upper end and the lower end of the data.
Python3
array = [np.random.randint(100) for i in range(100)]
AlreadySelected = []
i = 0
while (i < 5):
x = np.random.choice(array)
y = x - mean*3
array = np.append(array, y)
if (x not in already_selected):
AlreadySelected.append(y)
i += 1
else:
continue
i = 0
while (i < 5):
x = np.random.choice(array)
y = x + mean*4
array = np.append(array, y)
if (x not in already_selected):
AlreadySelected.append(y)
i += 1
else:
continue
std = np.std(array)
mean = np.mean(array)
plt.boxplot(array)
plt.title('Array with Outliers')
plt.show()
|
Output:
Output:
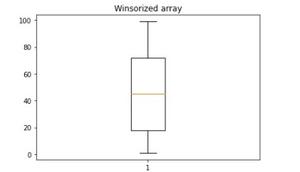
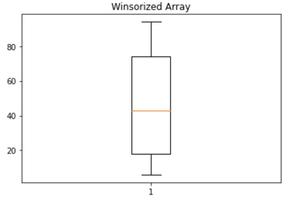
Now, we winsorize the array by 10% i.e. we winsorize 5% of the highest values and 5% of the lowest value of the array:
Python3
WinsorizedArray = winsorize(array,(0.05,0.05))
plt.boxplot(WinsorizedArray)
plt.title('Winsorized array')
plt.show()
|
Output:
Python3
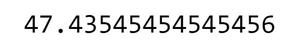
WinsorizedMean = np.mean(WinsorizedArray)
print(WinsorizedMean)
|
Output:

In this case, there is only a slight change in the mean value of the data.
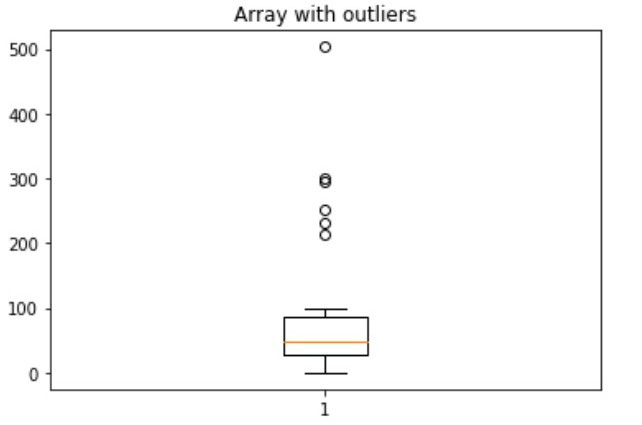
Now, let us see an example where outliers are present only at one end of the data.
Python3
array2 = [np.random.randint(100) for i in range(100)]
std = np.std(array2)
mean = np.mean(array2)
AlreadySelected = []
i = 0
while (i<5):
x = np.random.choice(array2)
y = x + mean*4
array2 = np.append(array2,y)
if (x not in AlreadySelected):
AlreadySelected.append(y)
i+=1
else:
continue
plt.boxplot(array2)
plt.title('Array with outliers')
plt.show()
|
Output:
Python3
OutlierArray2Mean = np.mean(array2)
print(OutlierArray2Mean)
|
Output:
Python3
WinsorizedArray2 = winsorize(array2,(0.1,0.1))
plt.boxplot(WinsorizedArray2)
plt.show()
WinsorizedArray2Mean = np.mean(WinsorizedArray2)
|
Output:
Python3
WinsorizedArray2Mean = np.mean(WinsorizedArray2)
print(WinsorizedArray2Mean)
|
Output:
In this case, there is a significant difference in the mean value.
Share your thoughts in the comments
Please Login to comment...