Why does survift give return two curves?
Last Updated :
21 Feb, 2024
In R Programming Language the survfit function from the survival package is used to compute Kaplan-Meier survival curves for time-to-event data. When you use survfit to analyze survival data, it typically returns two curves when two or more groups are being compared. These curves represent the estimated survival probabilities for each group over time.
What is Survfit?
In survival analysis, the “survfit” function often returns two curves because it estimates the survival function using Kaplan-Meier estimation, which is a non-parametric method commonly used when analyzing time-to-event data, particularly in medical research or reliability engineering.
The two curves typically represent.
- Overall Survival Curve: This curve shows the probability of survival over time for the entire population under study. It gives a general picture of how survival rates change over time without considering any other factors.
- Survival Curves Stratified by Groups: In many cases, survival analysis involves comparing survival between different groups or categories (e.g., treatment groups, risk groups, etc.). The second curve(s) returned by the “survfit” function might represent survival curves for each of these groups. This allows for comparisons between groups to assess whether there are significant differences in survival rates.
These curves are essential for understanding the behavior of the data, identifying trends, and making comparisons between different groups or treatments. They provide valuable insights into the survival probabilities over time and are fundamental in many types of survival analyses.
What is Survival Analysis ?
Survival analysis, also known as time-to-event analysis or reliability analysis, is a statistical method used to analyze the time until the occurrence of an event of interest. This event could be anything from the failure of a machine, the onset of a disease, the death of a patient, or any other event where time until occurrence is relevant. Survival analysis is widely used in various fields including medical research, engineering, economics, and social sciences.
Key Features of survift curves
- Time-to-Event Data: Survival analysis deals with data where the outcome of interest is the time until the occurrence of an event. Each observation typically consists of a time variable representing the time until the event (or censoring) occurs, and an event indicator variable indicating whether the event has occurred (or censoring has happened) for that observation.
- Censoring: Censoring occurs when the exact time of an event is not known but only that it occurred after a certain time or before a certain time. Censoring is a common feature in survival data and needs to be appropriately handled in analysis.
- Survival Function: The survival function (S(t)) gives the probability that an event has not occurred by time (t). It represents the probability of surviving beyond time (t). The Kaplan-Meier estimator is often used to estimate the survival function non-parametrically.
- Hazard Function: The hazard function (h(t)) gives the instantaneous rate at which events occur at time (t), conditional on survival up to time (t). It represents the risk of experiencing the event at time (t), given that the individual has survived up to that time.
- Survival Curves: Survival curves, also known as Kaplan-Meier curves, are graphical representations of the survival function. They show the proportion of subjects surviving at different time points.
- Comparing Survival: Survival analysis allows for the comparison of survival experiences between different groups or treatments using techniques such as the log-rank test, Cox proportional hazards regression, or parametric survival models.
Survival analysis enables researchers to understand the time dynamics of events, identify factors influencing the timing of events, and make predictions about future events. It’s a powerful tool for studying outcomes in situations where the time until an event occurs is of primary interest.
What is Kaplan-Meier curves?
Kaplan-Meier curves, named after Edward L. Kaplan and Paul Meier, are graphical representations of the estimated survival function derived from time-to-event data. These curves are a fundamental tool in survival analysis for estimating the probability of survival over time, particularly in situations where censoring is present.
- Non-parametric Estimation: Kaplan-Meier curves provide a non-parametric estimation of the survival function (S(t)), which represents the probability of surviving beyond time (t). The estimation does not assume any specific distribution for the survival times, making it suitable for various types of data.
- Step Function: Kaplan-Meier curves are typically step functions, where each step represents a time point at which an event (or censoring) occurs. The steps rise or fall based on the occurrence of events, reflecting changes in the estimated survival probability over time.
- Handling Censoring: Kaplan-Meier curves appropriately handle censored observations, where the exact time of an event is not known but only that it occurred after a certain time or before a certain time. Censored observations are taken into account when estimating the survival probabilities at each time point.
- Visualization: Kaplan-Meier curves provide a visual representation of the survival experience of a group of individuals over time. They allow researchers to assess the probability of survival at different time points and compare survival experiences between different groups or treatments.
Overall, Kaplan-Meier curves are a powerful tool for analyzing and visualizing survival data, providing valuable insights into the probability of survival over time and facilitating comparisons between groups. They are commonly used in medical research, epidemiology, and other fields where analyzing time-to-event data is essential.
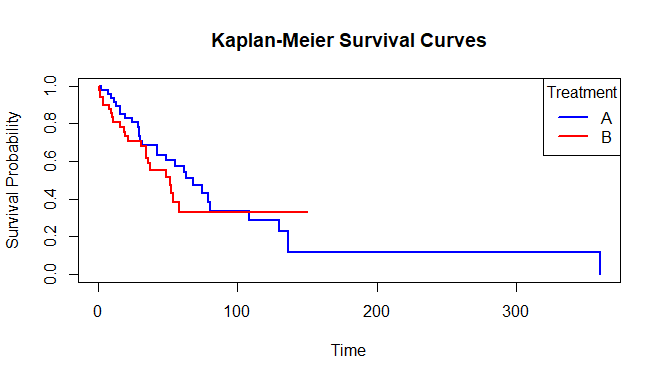
Implement Kaplan-Meier curves in R
R
library(survival)
set.seed(123)
treatment <- factor(rep(c("A", "B"), each = 50))
survival_time <- rexp(100, rate = ifelse(treatment == "A", 0.02, 0.03))
status <- sample(0:1, 100, replace = TRUE)
surv_obj <- Surv(survival_time, status)
km_fit <- survfit(surv_obj ~ treatment)
plot(km_fit, col = c("blue", "red"), lwd = 2, xlab = "Time",
ylab = "Survival Probability", main = "Kaplan-Meier Survival Curves")
legend("topright", legend = levels(treatment), col = c("blue", "red"), lwd = 2,
title = "Treatment")
|
Output:
survift curves
This code first creates some example data representing survival times and treatment groups. Then it creates a survival object using the
- Surv function from the survival package.
- After that, it fits Kaplan-Meier survival curves using the survfit function.
- Finally, it plots the Kaplan-Meier curves using the plot function and adds a legend to indicate the treatment groups.
Understanding Kaplan-Meier Curves
- Overall Survival Curve:- The first curve, typically plotted in a Kaplan-Meier analysis, represents the overall survival probability for the entire population under study. It shows how the probability of survival changes over time without considering any specific subgroups or categories.
- Survival Curves Stratified by Groups:- The second set of curves returned in Kaplan-Meier analysis represent survival probabilities for different groups or categories within the study population. Each curve corresponds to a distinct subgroup, such as treatment groups, risk categories, or demographic characteristics.
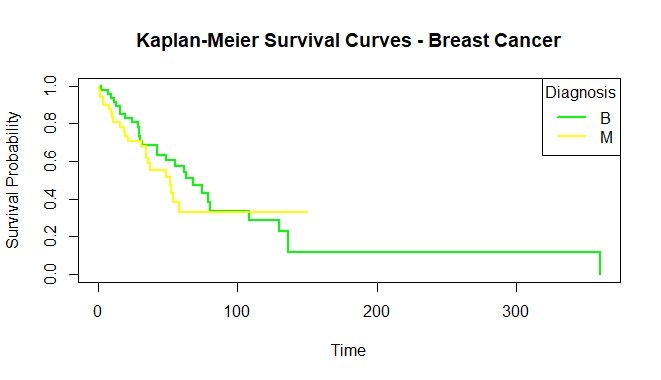
Clinical Trials in Oncology
In the field of oncology, survival analysis and Kaplan-Meier curves are essential tools for evaluating the efficacy of cancer treatments in clinical trials. Let’s check how these methods are applied in a real-world scenario:
- Application Scenario: – A pharmaceutical company is conducting a clinical trial to evaluate the effectiveness of a new chemotherapy regimen for patients diagnosed with metastatic breast cancer.
- Here we take Breast Cancer Dataset to perform this
R
library(survival)
library(tidyverse)
data <- read.csv("data.csv")
missing_values <- sum(is.na(data$radius_mean) | is.na(data$id))
if (missing_values > 0) {
print(paste("Warning: There are", missing_values,
"missing values in 'radius_mean' or 'id' column."))
}
data <- na.omit(data)
levels <- levels(data$diagnosis)
print(levels)
data$diagnosis <- as.factor(data$diagnosis)
surv_obj <- Surv(time = data$id, event = as.numeric(data$diagnosis == "M"))
km_fit <- survfit(surv_obj ~ diagnosis, data = data)
plot(km_fit, col = c("green", "yellow"), lwd = 2, xlab = "Time",
ylab = "Survival Probability",
main = "Kaplan-Meier Survival Curves - Breast Cancer")
if (!is.null(levels)) {
legend("topright", legend = levels, col = c("green", "yellow"), lwd = 2,
title = "Diagnosis")
}
|
Output:
survift curves
Load Libraries: The code begins by loading the necessary libraries for survival analysis (`survival`) and data manipulation (`tidyverse`).
- Load Dataset: It loads the dataset named “data.csv” located at the specified file path.
- Check for Missing Values: The code checks for missing values in the ‘radius_mean’ and ‘id’ columns. If missing values are found, a warning message is printed.
- Remove Rows with Missing Values: Rows with missing values are removed from the dataset using `na.omit()` function.
- Check Levels of ‘diagnosis’ Column: The levels of the ‘diagnosis’ column are checked and stored in the variable `levels`.
- Convert ‘diagnosis’ to Factor Variable: The ‘diagnosis’ column is converted to a factor variable using `as.factor()` function.
- Create Survival Object: A survival object `surv_obj` is created using the `Surv()` function. Here, ‘time’ is set to ‘id’ column and ‘event’ is set based on whether ‘diagnosis’ is “M” or not.
- Fit Kaplan-Meier Survival Curves: Kaplan-Meier survival curves are fitted using `survfit()` function. It models survival probability over time, stratified by ‘diagnosis’.
- Plot Kaplan-Meier Curves: The Kaplan-Meier curves are plotted using `plot()` function. The plot represents survival probability over time with modified colors and design.
- Add Legend: A legend is added to the plot only if there are levels present in the ‘diagnosis’ column. The legend indicates the categories of ‘diagnosis’ with corresponding colors.
Advantages
- Automated missing data handling.
- Flexible plotting customization.
- Dynamic legend adds clarity.
- Utilizes factor variables for analysis.
- Performs robust survival analysis.
Disadvantages
- Lack of comprehensive error handling.
- Assumes ‘M’ as the event without validation.
- Limited explanatory comments.
- Static plotting parameters limit adaptability.
- Dependency on external libraries adds complexity.
Conclusion
The survfit function in R from the survival package returns two curves in Kaplan-Meier survival analysis to estimate survival probabilities over time. These curves represent overall survival for the entire population and survival stratified by different groups or categories. Survival analysis is crucial in various fields, especially in medical research, for understanding time-to-event data and making informed decisions. Kaplan-Meier curves provide valuable insights into survival dynamics and are essential for comparing outcomes between groups. However, while implementing Kaplan-Meier curves in R, it’s important to handle missing data, validate assumptions, and ensure clear visualization with appropriate legends.
Share your thoughts in the comments
Please Login to comment...