View Function in R
Last Updated :
21 Feb, 2024
The `View()` function in R Programming Language looks like a window into the data. It’s a simple yet powerful tool, allowing users to peek inside datasets in a way that’s easy to understand. It functions like opening up a spreadsheet where data is neatly organized in rows and columns. With `View()`, individuals don’t need to be coding experts to explore their data. This function is designed to simplify the process for everyone, from beginners to expert data analysts.
What is the View() Function?
The View() function in R is a built-in function that allows users to view the contents of data structures interactively in a spreadsheet-like format. When we use the View() function, it opens a separate window or tab (depending on your R environment) displaying the data in a table format, making it easier to explore and understand the structure and contents of the data.
Features of the View() function in R
- Displays data interactively in a spreadsheet-like format.
- Allows sorting columns, filtering rows, and searching for specific values.
- Provides information about variables, such as data types and summary statistics.
- Offers options to export data to external files like CSV or Excel.
How to Use View()?
For using View() function there is some steps.
- Creating Data Frames
- Viewing Data
- Exploring Data
- Sorting
- Filtering
- Searching
- Variable Info
- Exporting
- Interacting with Data
- Closing the Viewer
Creating Data Frames
R
ID <- c(1, 2, 3, 4, 5)
Name <- c("Alice", "Bob", "Charlie", "David", "Eva")
Age <- c(25, 30, 22, 35, 28)
Score <- c(85, 92, 78, 95, 89)
|
Combine Vectors into a Data Frame
Use the data.frame() function to combine the vectors into a data frame, specifying column names if needed.
R
data <- data.frame(ID, Name, Age, Score)
data
|
Output:
  ID    Name Age Score
1  1   Alice  25    85
2  2     Bob  30    92
3  3 Charlie  22    78
4  4   David  35    95
5  5     Eva  28    89
View the Data Frame with View Function in R
View the created data frame using the View() function to see its contents in a viewer window.
Output:
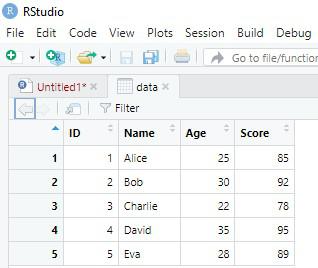
View Function in R
Exploring Data
Here we take a Iris dataset and filtering the data based on their Sepal Length which are greater than 5.0 cm.
R
library(dplyr)
data <- iris
filtered_data <- data %>% filter(Sepal.Length > 5.0)
View(filtered_data)
|
Output:

- Sorting: After opening the filtered data frame in the viewer window/tab, we can sort data by clicking on column headers. Click once to sort in ascending order and click again to sort in descending order.
- Searching: Utilize the search feature within the viewer window/tab to find specific values or patterns. Enter the search query in the search box provided in the viewer.
- Variable Info: Hover over column headers within the viewer window/tab to see information about variables. This information may include data types, levels for factors, or summary statistics
Exporting
Utilize options within the viewer window/tab to export data to CSV, Excel, or other formats if needed.
R
write.csv(filtered_data, "filtered_iris_data.csv", row.names = FALSE)
|
Interacting with Data
Explore and interact with the data dynamically in the viewer window/tab. We can scroll through the data, sort columns, filter rows, or search for specific values interactively.
Closing the Viewer
Once finished exploring the data, now close the viewer window/tab manually by clicking on the close button or using the appropriate option provided by the R environment.
Advantages
- Quick and easy data exploration
- Interactive features for insights
- Seamless integration with R environment
Disadvantages
- Limited functionality for complex tasks
- Resource-intensive with large datasets
- Platform-dependent appearance
- Limited export options
Conclusion
The `View()` function in R is a handy tool for exploring data easily. It lets users interactively explore into their datasets, gaining insights quickly. While it’s simple to use, it may struggle with complex tasks and can be resource-intensive with large datasets. Still, it’s a valuable feature for anyone looking to understand their data in the R environment.
Share your thoughts in the comments
Please Login to comment...