Using ipdb to Debug Python Code
Last Updated :
24 Aug, 2023
Internet Pinball Machine Database(IPDB) is a powerful debugging tool that is built on top of the IPython shell. It allows developers to step through their code line by line, set breakpoints, and inspect variables in real-time. Unlike other debuggers, IPDB runs inside the Python interpreter, which makes it easier to use and integrate with other tools.
Required Modules
pip install ipdb
How to use IPDB
After the debugger is installed, now you can start using IPDB by adding the following line of code:
import ipdb;
#code
ipdb.set_trace()
This line of code will set a breakpoint in your code at the point where it is executed. When the code reaches this point, the debugger will pause execution and drop you into an interactive shell where you can start debugging.
From here, you can use various IPDB commands to step through your code, inspect variables, and more. Some of the most commonly used commands include:
|
command
|
keyword
|
function
|
|
next
|
n
|
Execute the current line and move to the next one
|
|
step
|
s
|
Step into the function call on the current line
|
|
continue
|
c
|
Continue execution until the next breakpoint or the end of the program
|
|
print
|
p
|
Print the value of a variable
|
|
quit
|
q
|
Quit the debugger
|
Examples
Iterating through the loop
The function factorial(n), which is defined in this code, uses recursion to get the factorial of a given integer n. In this case, the method returns 1 if n is less than or equal to 0. If not, it calls itself recursively with n-1 as the argument and multiplies the outcome by n. After the factorial() function declaration, the code additionally places a breakpoint using ipdb.set_trace().
Python3
import ipdb
def factorial(n):
if n <= 0:
return 1
else:
return n * factorial(n-1)
ipdb.set_trace()
num = 5
fact = factorial(num)
print("Factorial of", num, "is", fact)
|
Output :
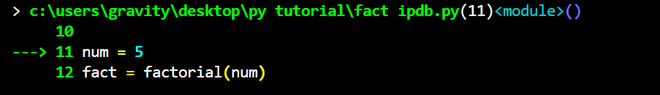
the terminal will open like this and you can control the compiler using commands
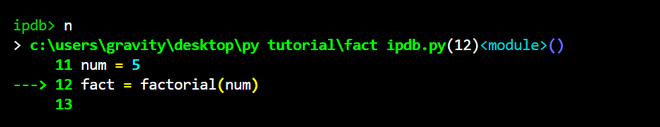
giving ‘n’ command, execution will be taken to the next breakpoint
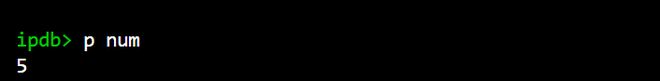
‘p’ command will print the value of the variable i.e. ‘num’
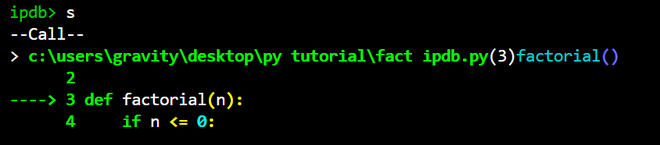
‘s’ step into the function call on the current line
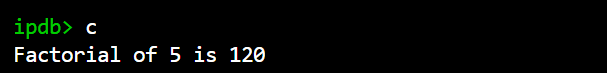
‘c’ takes to the next breakpoint or end of the program
Viewing sorting program
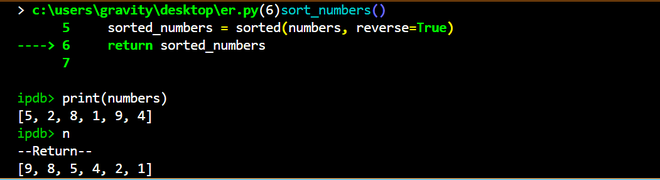
Sort_numbers() and main() are two functions defined in this code. sort_numbers() takes a list of numbers as input, uses ipdb.set_trace() to set a breakpoint, uses the sorted() function to sort the numbers in descending order, and then returns the sorted list.
Python3
import ipdb
def sort_numbers(numbers):
ipdb.set_trace()
sorted_numbers = sorted(numbers, reverse=True)
return sorted_numbers
def main():
numbers = [5, 2, 8, 1, 9, 4]
sorted_numbers = sort_numbers(numbers)
print(sorted_numbers)
main()
|
Output:
When we run the code again, we’ll see that it pauses at the breakpoint, and we can use various IPDB commands to examine the state of the program. For example, we can use the print command to check the value of the numbers argument :
IPDB example
Simple multiply and add the program
In this code, we are using the ipdb.set_trace() instruction, the code places a breakpoint. When this happens, the Python debugger will halt the program’s execution at that particular moment to allow the user to investigate the status of the program at that time. Following the breakpoint, the program executes add(), passing result1 and y as inputs, and saving the outcome in result2. The value of result2 is finally written to the console.
Python3
import ipdb
def multiply(x, y):
result = x * y
return result
def add(x, y):
result = x + y
return result
def main():
x = 5
y = 10
result1 = multiply(x, y)
ipdb.set_trace()
result2 = add(result1, y)
print(result2)
main()
|
Output :
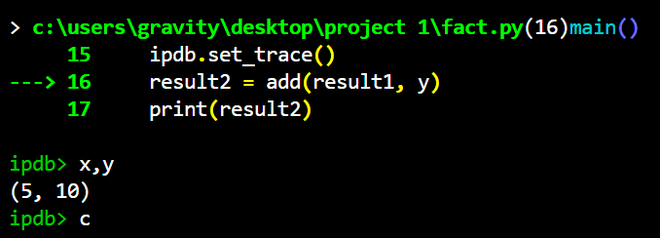
IPDB example
Difference between pdb debugger and ipdb debugger
Both PDB and IPDB support column-based debugging, which means that you can set a breakpoint at a specific column in a line of code. However, IPDB offers some additional functionality that makes it more user-friendly and powerful than PDB.
|
features
|
pdb
|
ipdb
|
|
User Interface
|
- No syntax highlighting
- No tab-completion.
- Don’t allow customization
|
- Syntax highlighting
- Tab-completion.
- Allows you to customize the way that your debugger display looks
|
|
Additional Features
|
Limited additional features beyond basic debugging capabilities.
|
Additional features such as post-mortem debugging and the ability to set breakpoints at specific columns.
|
|
Installation
|
Included Python by default.
|
Needs to be installed separately using pip.
|
|
Compatibility
|
Compatible with IPDB.
|
Fully compatible with PDB
|
Share your thoughts in the comments
Please Login to comment...