Unified Modeling Language (UML) is a standardized modeling language widely used in software engineering for visualizing, specifying, constructing, and documenting the artifacts of a system. UML provides a set of graphical notations and a framework for modeling complex systems, helping software developers and system architects communicate and understand the design of a system more effectively.
Think of UML as a set of drawings or diagrams that help people see and grasp different parts of a software project. It’s like a visual toolkit that makes it easier to explain ideas, plan how things will work together, and document the whole process. This way, everyone working on the project can be on the same page, reducing misunderstandings and making the whole development process smoother. The Object Management Group (OMG) liked this idea so much that they officially adopted UML in the 1990s, and since then, it’s been widely used in the software development world.
Timetable Generating System
The Timetable Generating System outlines a roadmap for enhancing the scheduling process by addressing the problem through clear definition, strategic solutions, and efficient implementation, ultimately automating and optimizing the college timetable creation for a more user-friendly academic experience.
.png)
The primary objective of this project is to analyze the requirements of students and faculty, design and implement an automated timetable system, rigorously test its functionality, and ensure ongoing maintenance of the software.
- The system will be tailored to address the specific scheduling needs of the college, aligning with the predefined requirements.
- The purpose of the project is to develop a system that will generate a timetable for each course and faculty, considering the availability calendar of faculties, availability of physical resources such as classrooms, laboratories, and rules applicable at different classes, semesters, faculties, and subject levels.
- This timetable generation system improves resource utilization and optimization and also reduces manual labor and time consumption as the timetable is generated automatically.
UML Diagrams
UML diagrams come in different types, each serving a specific purpose in the software development lifecycle. Some of the most commonly used UML diagrams include:
1. Use Case Diagram
A use case diagram is a visual representation that helps describe how a system interacts with its users, or actors, to achieve specific goals or tasks. It’s a way to illustrate the functionalities of a system from a user’s perspective, focusing on what users want to accomplish. Some of the terms used in the use case diagram are:
- Actors: Actors are the external entities (People, other systems, or even devices) that interact with the system. In simple terms, they’re the users or things that do something with the system. In the timetable generating system actors could be the Admin, Staff, and Students.
- Use Cases: Use cases represent specific functionalities or actions that the system can perform. These are the things users can do with the system. Each use case should be meaningful from the user’s perspective. In a timetable generating system use cases could be the Login, Semester and subject details, Faculty information and timings, and Generating and viewing timetable.
- Relationships: Lines, often called associations, connect actors to use cases. These lines show which actors are involved in each use case. It’s a way of visually representing who interacts with which functionalities.
- System Boundary: A boundary, typically a rectangle, encloses all the use cases of a system. It defines the scope of the system under consideration.
Use case diagrams are beneficial during the early stages of software development or when discussing system requirements. They provide a high-level overview, making it easier for stakeholders, including developers, designers, and clients, to understand how the system will function without delving into technical details. By focusing on user interactions and goals, use case diagrams contribute to better communication and collaboration among the project team.

Use case Diagram for Timetable Generating System
2. Activity Diagram
An activity diagram is a type of UML diagram that focuses on illustrating the flow of activities or actions within a system or a specific business process. It provides a visual representation of how different tasks or activities are carried out, their sequence, and the conditions that guide their execution. Some of the terms used in the activity diagram are:
- Activities: Activities represent the specific tasks or actions that occur within the system or process. These can range from simple actions like Admin login to more complex processes like generating a timetable.
- Transitions: Arrows, often called transitions or edges, connect activities to show the flow or sequence of actions. They indicate the order in which activities are performed. For example, if you’re depicting the process of generating a timetable then transitions would show the steps from inserting the course and faculty details and setting the break timings to generate a timetable.
- Decision Nodes: Decision nodes represent points where the flow of activities can take different paths based on certain conditions. It’s like a decision point in the process where different actions might be taken depending on specific criteria. In the timetable-generating system, a decision node is positioned below the Admin login. If the entered credentials are valid, the admin gains access to the homepage; otherwise, the page redirects back to the login page.
- Forks and Joins: Forks represent points in the diagram where the flow splits into multiple concurrent paths, indicating parallel activities. Joins are the opposite, where multiple paths come together.
Activity diagrams are particularly useful for modeling business processes, workflows, and complex procedures. They help stakeholders understand the dynamic aspects of a system, including the order of actions and decision points, fostering better comprehension and communication among team members. Activity diagrams are commonly employed during the analysis and design phases of software development to ensure a clear understanding of the system’s behavior.
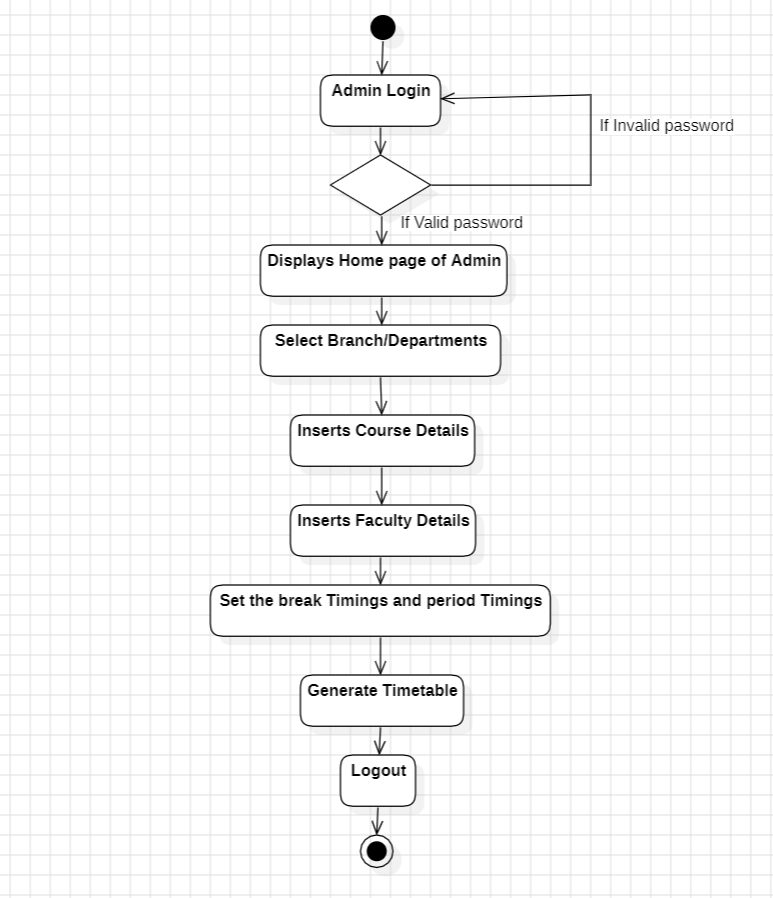
Activity Diagram of Timetable Generating System
3. Class Diagram
A class diagram is a type of UML diagram that provides a visual representation of the static structure and relationships within a system. It primarily focuses on the classes, their attributes, methods, and the associations between classes. Class diagrams are especially useful for modeling the structure of object-oriented systems. Some of the terms used in the class diagram are:
- Class: Represents a blueprint or template for creating objects. A class typically contains attributes (properties) and methods (functions or operations). In the Timetable generating system, you might have the Admin, Staff, and Course classes.
- Attributes: These are the properties or characteristics of a class. Attributes are often depicted as variables inside the class box. In the Staff class example, ID, Name, and Qualification are the Attributes.
- Operations: Operations represent the actions or behaviors that a class can perform. They are functions or procedures associated with a class. In the Admin class Add, Delete, and Assign are the operations.
- Associations: Lines connecting classes indicate relationships between them. Associations represent how classes are related and can be one-to-one, one-to-many, or many-to-many. For instance, a Staff class might be associated with many Course classes, indicating that one faculty can teach multiple courses.
Class diagrams are instrumental during the design phase of software development. They help developers visualize the structure of their system, understand the relationships between classes, and ensure a well-organized and modular design.
.png)
Class Diagram for Timetable Generating System
4. Sequence Diagram
A sequence diagram is a type of UML diagram that illustrates the dynamic interactions between objects or components in a system over time. It focuses on the sequence of messages exchanged between different entities to achieve a specific behavior or scenario. Sequence diagrams are particularly useful for modeling the flow of operations or events in a system. Some of the terms used in a sequence diagram are:
- Lifelines: Each participant in the sequence diagram is represented by a vertical line called a lifeline. Lifelines depict the existence of an object over some time. Lifelines can be anything from classes, components, or instances of classes.
- Activation Boxes: Horizontal rectangles along the lifelines represent the period during which an object is active or processing a specific message. Activation boxes help visualize the duration of an operation or method call.
- Messages: Arrows between lifelines represent messages exchanged between objects. Messages can be synchronous (the sender waits for a response) or asynchronous (the sender continues without waiting). They show the flow of control and communication between objects.
- Return Messages: Indicate the return of control from a called method or operation back to the calling object. Return messages are represented with a dashed line.
- Interaction Occurrences: Represent iterations or loops within the sequence diagram. They help depict repetitive interactions between objects.
- Conditions and Loops: Conditions and loops can be added to sequence diagrams to show decision points or repeated sequences of interactions.
Sequence diagrams are especially valuable for capturing the dynamic behavior of a system during a specific scenario or use case. They help developers understand the chronological order of interactions between objects and provide insights into the timing and dependencies of different operations. Sequence diagrams are commonly used during the analysis and design phases of software development to ensure a clear understanding of how components collaborate and communicate in the system.

Sequence Diagram for Timetable Generating System
5. State chart Diagram
A state chart diagram is a type of UML diagram that represents the dynamic behavior of a system in response to external stimuli and internal conditions. It focuses on modeling the different states that an object or a system can be in and the transitions between these states based on events. Some of the terms used in a state chart diagram are:
- State: A state represents a condition or situation in the life of an object or system. In a timetable-generating system, the states are Admin Login, Homepage, Course, and faculty details.
- Transition: Transitions show how an object moves from one state to another in response to an event. Events trigger transitions and actions associated with transitions describe what happens when the transition occurs.
- Initial State: Represents the starting point of an object or system before any events or transitions take place.
- Final State: Represents the end of an object’s life or a specific process within the system.
- Superstate: A grouping mechanism to represent a set of related states. It’s useful for simplifying complex state charts by organizing states into higher-level superstates.
- Guard Conditions: Conditions associated with transitions that determine whether the transition should occur based on certain criteria. For example, a guard condition could specify that a transition only occurs if a certain variable is within a specific range.
Statechart diagrams are particularly effective for modeling the behavior of systems with distinct and well-defined states. They are commonly used in software engineering, especially in the design and analysis phases, to represent the behavior of objects in reactive systems. State charts help in visualizing the different states a system can be in, the events that trigger transitions between states, and the actions associated with these transitions, providing a clear understanding of the system’s behavior over time.

State chart Diagram for Timetable Generating System
6. Object Diagram
An object diagram is a type of UML diagram that provides a snapshot of the instances of classes in a system at a specific point in time. It represents a set of objects and their relationships, showing how they collaborate to fulfill a certain scenario or use case. Some of the terms used in Object diagram are:
- Object: Represents an instance of a class in the system. Each object is depicted as a box with the object’s name and its attributes and values.
- Link: A line connecting two objects to represent a relationship or association between them. The link may include multiplicity annotations to indicate the number of objects involved in the relationship.
- Multiplicity: Indicates the number of instances participating in a particular relationship. It is often shown near the end of a link, representing the minimum and maximum number of instances allowed.
- Object’s State: If relevant to the scenario, the object’s state or attribute values at the specific point in time may be included. This helps in illustrating the state of the objects in the system.
Object diagrams are useful for visualizing the relationships between instances of classes and how they collaborate during a specific scenario. They provide a concrete representation of the objects and their associations, offering a more detailed view than class diagrams, which focus on the structure of classes. Object diagrams are particularly helpful during the design phase of software development when you want to show how a set of objects interact or collaborate to achieve a specific functionality. They help in understanding the actual instances of classes and their relationships in a real-world context.

Object Diagram for Timetable Generating System
7. Swimlane Diagram
A swimlane diagram, also known as a cross-functional flowchart or process map, is a visual representation that illustrates how different individuals, departments, or entities within an organization contribute to a particular process. The diagram is called a “swimlane” because the chart is divided into distinct lanes, each representing a specific role, department, or participant in the process. Some of the terms used in swimlane diagrams are:
- Lanes: Horizontal or vertical divisions on the diagram represent different participants or functional areas involved in the process. Each lane typically contains a role or department name.
- Activities/Processes: Tasks or activities in the process are represented by shapes, such as rectangles. These shapes are placed within the lanes to indicate which participant or department is responsible for performing that specific task.
- Arrows/Connectors: Arrows connecting the activities show the flow of the process. They indicate the sequence in which tasks are performed and the direction of the workflow.
- Decisions: Diamond-shaped symbols are used to represent decision points in the process. Depending on the outcome of the decision, the flow may follow different paths.
- Start and End Points: Oval shapes typically denote the starting and ending points of the process. They represent the initiation and completion of the workflow.
- Annotations: Text labels and annotations provide additional information about the activities, decisions, or process steps. This helps in understanding the details of the workflow.
Swimlane diagrams are valuable tools for visualizing complex processes, as they depict the interactions between different departments or roles. They are commonly used in business process improvement, project management, and system analysis to identify bottlenecks, streamline workflows, and enhance collaboration between different stakeholders. These diagrams are versatile and can be adapted for various purposes, making them a widely used tool in business and project management to enhance communication and understanding of complex processes.
-(1).png)
Swimlane Diagram for Timetable Generating System
In simple terms, Unified Modeling Language (UML) is a crucial tool in software engineering. It helps people understand, design, and talk about complex systems in a standardized and visual way. The Timetable Generating System project shows how different UML diagrams, like Use Case, Activity, Class, Sequence, State Chart, and Object diagrams, can be useful in different stages of software development.
Conclusion
Each type of UML diagram has a specific purpose, helping us understand things like system requirements, structure, behavior, and how different parts interact. Using these diagrams in the Timetable Generating System project makes communication between team members easier. It reduces the chances of misunderstandings and promotes collaboration.
From the early stages of system analysis to the design and implementation phases, UML diagrams play a pivotal role in ensuring that all team members, including developers, designers, and clients, share a common understanding of the project’s intricacies. The visual representations provided by UML diagrams enhance clarity, streamline development processes, and contribute to the overall success of the software project.
Share your thoughts in the comments
Please Login to comment...