Random Walk (Implementation in Python)
Last Updated :
06 Nov, 2021
Introduction A random walk is a mathematical object, known as a stochastic or random process, that describes a path that consists of a succession of random steps on some mathematical space such as the integers. An elementary example of a random walk is the random walk on the integer number line, which starts at 0 and at each step moves +1 or -1 with equal probability. Other examples include the path traced by a molecule as it travels in a liquid or a gas, the search path of a foraging animal, the price of a fluctuating stock and the financial status of a gambler can all be approximated by random walk models, even though they may not be truly random in reality. As illustrated by those examples, random walks have applications to many scientific fields including ecology, psychology, computer science, physics, chemistry, biology as well as economics. Random walks explain the observed behaviors of many processes in these fields and thus serve as a fundamental model for the recorded stochastic activity. As a more mathematical application, the value of pi can be approximated by the usage of random walk in the agent-based modeling environment.
Enough with the boring theory. Let’s take a break while getting some knowledge of the code. So, to code out the random walk we will basically require some libraries in python some to do maths, and some others to plot the curve.
Libraries Required
- matplotlib It’s an external library that helps you to plot the curve. To install this library type the following code in your cmd.
pip install matplotlib
It would be enough to get you through the installation.
- numpy It’s also an external library in python it helps you to work with arrays and matrices. To install the library type the following code in cmd.
pip install numpy
- random It’s a built-in library of python we will use to generate random points.
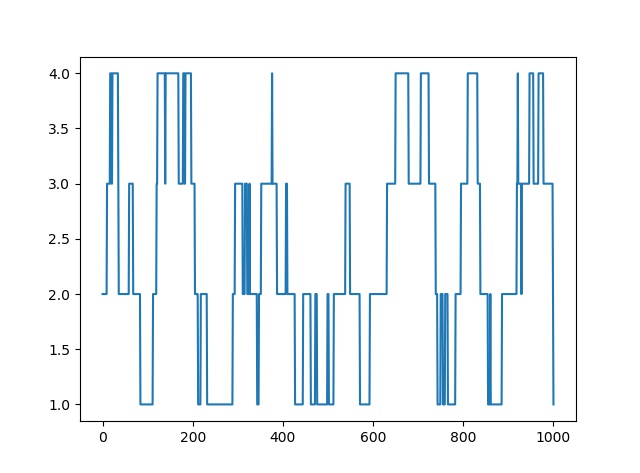
One-dimensional random walk An elementary example of a random walk is the random walk on the integer number line, which starts at 0 and at each step moves +1 or ? 1 with equal probability.
So let’s try to implement the 1-D random walk in python.
Python3
import random
import numpy as np
import matplotlib.pyplot as plt
prob = [0.05, 0.95]
start = 2
positions = [start]
rr = np.random.random(1000)
downp = rr < prob[0]
upp = rr > prob[1]
for idownp, iupp in zip(downp, upp):
down = idownp and positions[-1] > 1
up = iupp and positions[-1] < 4
positions.append(positions[-1] - down + up)
plt.plot(positions)
plt.show()
|
Output:
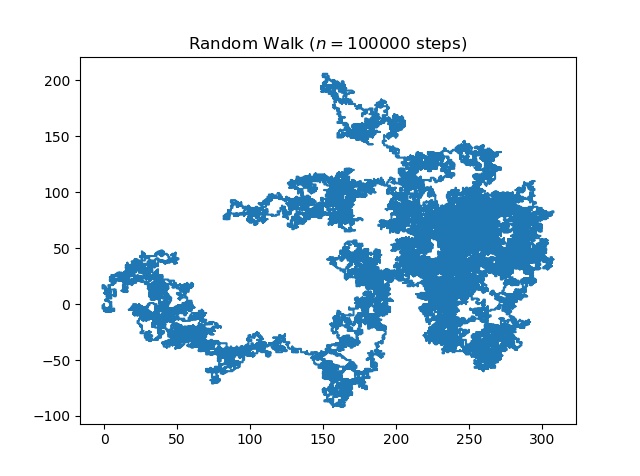
Higher dimensions In higher dimensions, the set of randomly walked points has interesting geometric properties. In fact, one gets a discrete fractal, that is, a set that exhibits stochastic self-similarity on large scales. On small scales, one can observe “jaggedness” resulting from the grid on which the walk is performed. Two books of Lawler referenced below are good sources on this topic. The trajectory of a random walk is the collection of points visited, considered as a set with disregard to when the walk arrived at the point. In one dimension, the trajectory is simply all points between the minimum height and the maximum height the walk achieved (both are, on average, on the order of ? n).
Let’s try to create a random walk in 2D.
Python3
import numpy
import pylab
import random
n = 100000
x = numpy.zeros(n)
y = numpy.zeros(n)
for i in range(1, n):
val = random.randint(1, 4)
if val == 1:
x[i] = x[i - 1] + 1
y[i] = y[i - 1]
elif val == 2:
x[i] = x[i - 1] - 1
y[i] = y[i - 1]
elif val == 3:
x[i] = x[i - 1]
y[i] = y[i - 1] + 1
else:
x[i] = x[i - 1]
y[i] = y[i - 1] - 1
pylab.title("Random Walk ($n = " + str(n) + "$ steps)")
pylab.plot(x, y)
pylab.savefig("rand_walk"+str(n)+".png",bbox_inches="tight",dpi=600)
pylab.show()
|
Output:
Applications
- In computer networks, random walks can model the number of transmission packets buffered at a server.
- In population genetics, a random walk describes the statistical properties of genetic drift.
- In image segmentation, random walks are used to determine the labels (i.e., “object” or “background”) to associate with each pixel.
- In brain research, random walks and reinforced random walks are used to model cascades of neuron firing in the brain.
- Random walks have also been used to sample massive online graphs such as online social networks.
References
1. Wikipedia – Random Walk
2. Stackoverflow – Random Walk 1D
3. matplotlib documentation
Share your thoughts in the comments
Please Login to comment...