Python – Pearson Correlation Test Between Two Variables
Last Updated :
19 Mar, 2024
What is correlation test?
The strength of the association between two variables is known as correlation test.
For instance, if we are interested to know whether there is a relationship between the heights of fathers and sons, a correlation coefficient can be calculated to answer this question.
For know more about correlation please refer this.
Methods for correlation analyses:
- Parametric Correlation : It measures a linear dependence between two variables (x and y) is known as a parametric correlation test because it depends on the distribution of the data.
- Non-Parametric Correlation: Kendall(tau) and Spearman(rho), which are rank-based correlation coefficients, are known as non-parametric correlation.
Note: The most commonly used method is the Parametric correlation method.
Pearson Correlation formula:
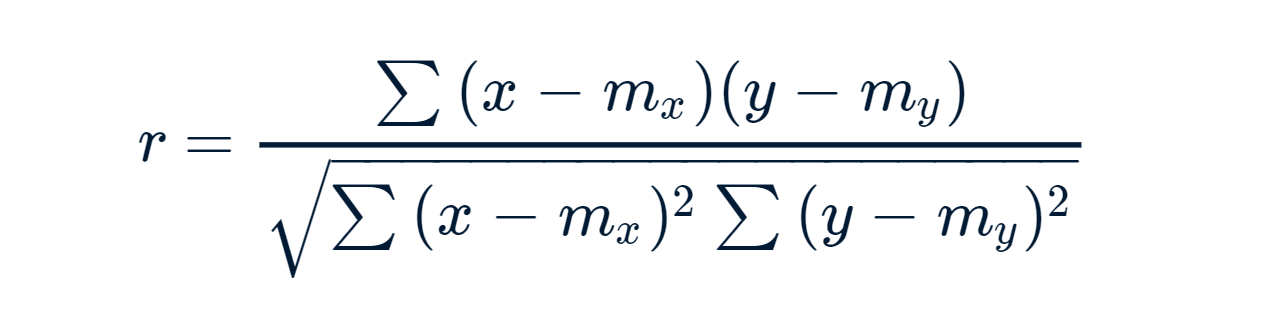
x and y are two vectors of length n
m, x and m, y corresponds to the means of x and y, respectively.
Note:
- r takes value between -1 (negative correlation) and 1 (positive correlation).
- r = 0 means no correlation.
- Can not be applied to ordinal variables.
- The sample size should be moderate (20-30) for good estimation.
- Outliers can lead to misleading values means not robust with outliers.
To compute Pearson correlation in Python – pearsonr() function can be used.
Python functions
Syntax:
pearsonr(x, y)
Parameters:
x, y: Numeric vectors with the same length
Data: Download the csv file here.
Code: Python code to find the pearson correlation
Python3
# Import those libraries
import pandas as pd
from scipy.stats import pearsonr

# Import your data into Python
df = pd.read_csv("Auto.csv")

# Convert dataframe into series
list1 = df['weight']
list2 = df['mpg']

# Apply the pearsonr()
corr, _ = pearsonr(list1, list2)
print('Pearsons correlation: %.3f' % corr)

# This code is contributed by Amiya Rout
Output:
Pearson correlation is: -0.878
Pearson Correlation for Anscombe’s Data:
Anscombe’s data also known as Anscombe’s quartet comprises of four datasets that have nearly identical simple statistical properties, yet appear very different when graphed. Each dataset consists of eleven (x, y) points. They were constructed in 1973 by the statistician Francis Anscombe to demonstrate both the importance of graphing data before analyzing it and the effect of outliers on statistical properties.
Those 4 sets of 11 data-points are given here. Please download the csv file here.
When we plot those points it looks like this. I am considering 3 sets of 11 data-points here.
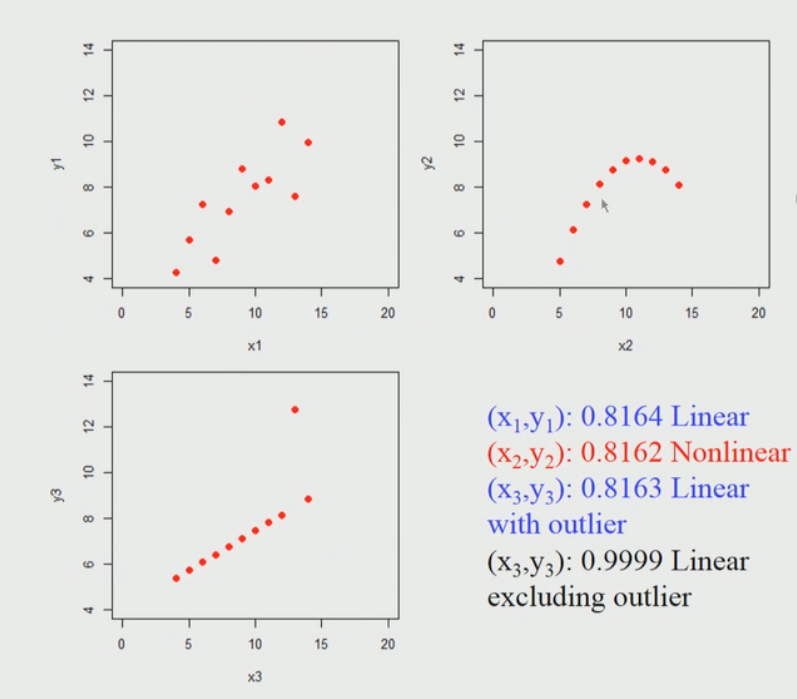
Brief explanation of the above diagram:
So, if we apply Pearson’s correlation coefficient for each of these data sets we find that it is nearly identical, it does not matter whether you actually apply into a first data set (top left) or second data set (top right) or the third data set (bottom left).
So, what it seems to indicate is that if we apply the Pearson’s correlation and we find the high correlation coefficient close to one in this first data set(top left) case. The key point is here we can’t conclude immediately that if the Pearson correlation coefficient is going to be high then there is a linear relationship between them, for example in the second data set(top right) this is a non-linear relationship and still gives rise to a high value.
Share your thoughts in the comments
Please Login to comment...