Power View in Excel
Last Updated :
06 Sep, 2023
In today’s data-driven world, the ability to turn raw data into meaningful insights is a skill that can unlock countless opportunities. Enter Power View, a remarkable data visualization technology that empowers users to transform their data into interactive and engaging charts, graphs, maps, and more. Whether you’re working with Excel, SharePoint, SQL Server, or Power BI, Power View is your gateway to bringing data to life like never before. In this article, we’ll explore the world of Power View and discover how it revolutionizes the way we visualize and understand data across various platforms. Whether you’re a seasoned data analyst or just starting your journey into the world of data visualization, Power View has something to offer that can enhance your data-driven decision-making processes. Let’s embark on this exciting journey to uncover the power of Power View!
What is Power View in Excel
Excel Power View is a data visualization tool that allows an individual to create dashboards, interactive reports, and presentations using data from various sources in Microsoft Excel. Power View enables one to create visually appealing graphs, charts, and other visualizations to gain insights and communicate data effectively.
Advantages of Power View in Excel
- Elevating your data presentations with engaging visuals
- Exploring interactive graphs to understand data better
- Extending data-model relationships for comprehensive analysis
- Utilizing data maps for geographical insights
- Tracking essential Key Performance Indicators (KPIs)
- Creating interactive charts to enhance data interpretation
How to Enable Power View in Excel
- Click the File tab on Excel
- Select Options
- Go to Add-Ins
- Click the drop-down arrow in the Manage box.
- Select COM Add-ins from the dropdown list and click Go
- Enable Microsoft Power View for Excel and Click Ok
- Right-click on Insert and Select Customize the Ribbon
- Select New Group on the right and create a new group, Rename it to Power View
- Choose commands from the list from Popular Commands to All Commands
- Scroll down the list and pick Power View
- Power View will be visible on the Ribbon.
Note: If you are unable to locate Microsoft Excel Power View in the add-in options, it is because Power View has been discontinued. Many of its functionalities have been incorporated into Microsoft’s newer Power BI platform.
Also Read
How to Create a Power View Report
Step 1: Import the Data
- Open Microsoft Excel
- Prepare or import your dataset. Here we’ll be using this dataset with headers: “Product,” “Sales Date,” “Region,” “Category,” and “Sales Amount.”
|
Sales Date
|
Region
|
Category
|
Sales Amount
|
| 01-07-2023 |
North |
Electronics |
1200
|
| 02-07-2023 |
South
|
Clothing |
800
|
| 02-07-2023 |
West
|
Electronics |
1500
|
| 03-07-2023 |
North |
Electronics |
900
|
| 03-07-2023 |
South
|
Clothing |
600
|
| 04-07-2023 |
West
|
Electronics |
1800
|
Step 2: Create a Pivot Table
- Select any cell within the data range.
- Go to the “Insert” tab in the Excel ribbon.
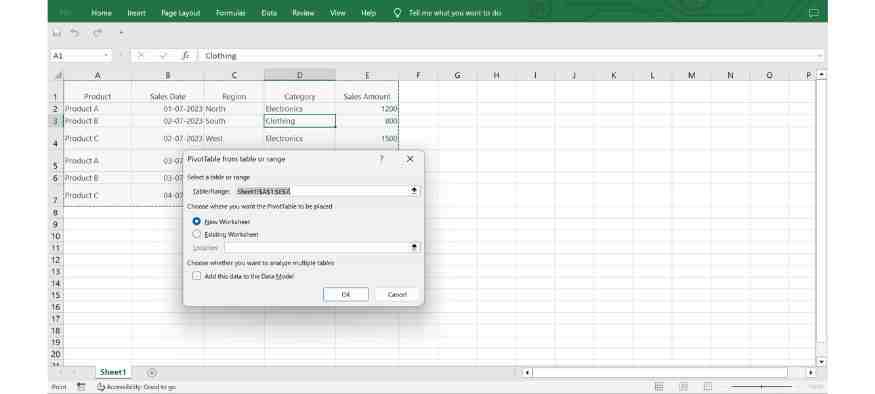
- Click on “PivotTable” in the “Tables” group.
- In the “Create PivotTable” dialog box, make sure the correct data range is selected, and choose whether to place the PivotTable in a new worksheet or an existing one.
- Click “OK” to create the Pivot Table.
Step 3: Design the PivotTable
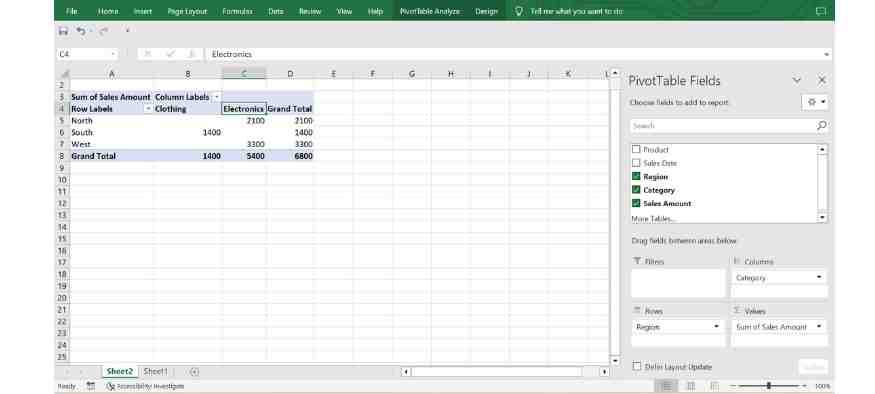
- In the PivotTable Fields pane on the right, drag and drop “Region” into the “Rows” area and “Category” into the “Columns” area.
- Drag and drop “Sales Amount” into the “Values” area. By default, it should be summarized as “Sum of Sales Amount.”
Step 4: Create a PivotChart
- Click anywhere within the PivotTable to activate the “PivotTable Tools” in the Excel ribbon.
- Go to the “Analyze” tab.
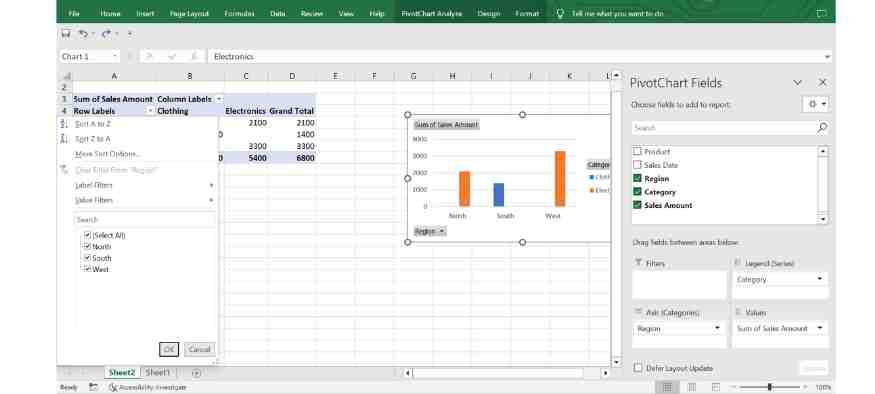
- Click on “PivotChart” in the “Tools” group.
- Choose the type of chart you want to create (e.g., Column chart, Bar chart, Line chart, etc.). Let’s choose a Clustered Column chart for this example.
Step 5: Power View Sheet Created
Excel will now create a new sheet in your workbook. This table is the basis of the Power View report. Here you can create interactive visualizations, charts and elements that effectively communicate your information.
- Fields pane: To the right of the Power View page, you’ll see the Fields pane. This panel displays all available fields in your dataset. You can use these fields to create visualizations.
- Visualizations: Start by dragging fields from the Fields pane onto the Power View page. Excel recommends appropriate visualizations based on the data types you select. For example, if you drag a date field and a number field, Excel may suggest a line chart.
- Customization: Use the Design tab on the Power View ribbon to format and customize visualizations. You can edit fonts, apply color schemes, add titles and customize various aspects of the visual.
How to Create Power View Visualizations
Step 1: Interact with the PivotTable and PivotChart
- You can interact with the PivotTable by using the drop-down arrows to filter, sort, and drill down into the data. For example, you can filter the data by a specific product or date range.
- The PivotChart will automatically update based on the changes made in the Pivot Table, allowing you to visualize the data dynamically.
Step 2: Save and Share the Workbook
- Once you have created the interactive report using PivotTables and PivotCharts, save the Excel workbook.
- Share the saved workbook with others via email, cloud storage, or any other file-sharing method.
Below is the example of how the output screen will look like in Excel
.jpg)
Output Screen
Also read
How to Share Power View Report in Excel
Sharing Power View reports in Excel is a dynamic way to collaborate on data analysis and insights within your organization. Excel Power View allows you to create interactive reports that recipients can explore and interact with, enhancing their understanding of the data. Sharing options include:
1) Excel Online Sharing
Share Power View reports using Excel Online. Recipients can access and interact with reports directly in a web browser without needing to download the Excel file.
2) Shared Folders and Libraries
Upload the Excel workbook containing Power View reports to shared folders on cloud platforms like OneDrive or SharePoint. Authorized team members can access and collaborate on the reports.
3) Email Attachments
Send the Excel file with the Power View report as an email attachment. However, this approach may limit collaboration and real-time updates.
4) Embedding in Web Pages
Embed Power View reports into web pages or blogs, making them accessible to a broader audience beyond Excel users.
How to Print Power View Report
Step 1: Optimize Layout
Adjust the layout of your Power View report to ensure it fits well within printed pages. Resize visuals and tables as needed.
Step 2: Preview Before Printing
Use the Print Preview function in Excel to see how the Power View report will look on paper. Make adjustments to optimize visual elements.
Step 3: Edit Page Setup
Configure page settings such as orientation (portrait or landscape), paper size, margins, and headers/footers to ensure the report is presented clearly.
Step 4: Export to PDF
For more precise control over formatting, consider exporting your Power View report to PDF format before printing. This ensures that the report retains its intended appearance.
How to Publish Excel Workbooks with Power View sheets to Power BI
Step 1: Create Power View Reports
Design your Power View report in Excel, ensuring it contains the desired visuals, interactivity, and data connections.
Step 2: Sign in to Power BI Service
Sign in to Power BI Service, a Microsoft’s cloud-based BI platform.
Step 3: Import from Excel
From the Power BI Service, use the “Import” feature to upload your Excel file containing the Power View report. Power BI will import the report and its interactive elements.
Step 4: Interact in Power BI
Once uploaded, your Power View report will maintain its interactivity in the Power BI Service. Users can interact with slicers, filters, and visuals online.
Step 5: Intergrate Power View Report in Power BI Dashboard
Integrate your Power View report into Power BI dashboards, combining it with other Power BI visuals and reports to create comprehensive insights.
FAQs
How to Enable Power View in Excel?
Click the drop-down arrow in the Manage Box > Select COM Add-ins from the dropdown list and click Go. The COM Add-ins dialog box appears. Check the box Power View and click OK.
Click on the link to learn more about: “How to Enable and Use Power View in Excel”.
What to do if Microsoft excel power view add-in is missing?
- Click the File tab on the Ribbon
- Click Option
- Click Add-Ins in the Excel Options dialog box
- Click the drop-down arrow in the Manage box.
- Select COM Add-ins from the dropdown list and click Go.
- The COM Add-ins dialog box appears. Check the box Power View and click OK.
- Power View will be visible on the Ribbon.
What happens if someone doesn’t have Excel installed?
Recipients without Excel can still view and interact with Power View reports using Excel Online or other compatible Excel viewers.
Can I share Power View reports with external stakeholders securely?
Yes, you can use platforms like OneDrive or SharePoint to share reports while controlling access through permissions.
Can I modify a Power View report after publishing it to Power BI?
After publishing, you’ll generally need to make changes in the original Excel file and republish it to see updates in Power BI.
Is Power View the Same as Power BI?
Power View can be characterized as the precursor to Power BI. Originally designed to visualize Excel PowerPivot models, Power View’s capabilities were subsequently integrated into Power BI, which expanded upon them by incorporating modern enterprise business intelligence (BI) features and advanced dashboarding capabilities.
Share your thoughts in the comments
Please Login to comment...