Key Performance Indicators in Excel Power View
Last Updated :
15 Jun, 2023
Key Performance Indicators (KPIs) are used for the visual measurement of business objectives. KPI are basically used by departments like sales, accounts, and human resources so that they can compare their current sales with their target. In KPI current sales are known as base value, and target sales are known as target value. KPI gives us many symbols to represent our quantifiable measurement. In Excel, we call this visual indicator status to represent the current status of its sales.
Follow the further steps to understand this topic properly by taking an example of an electronics shop where we will visualize the current sales of each product with respect to its targeted sales.
Step 1: Create a sample data sheet in Excel.
Step 2: Select the cell from A1 to B6.
Step 3: Select the Insert tab from the ribbon, and then select Power View.
Step 4: Then, go to the Power Pivot tab and then select Measures from the Calculations group.
Step 5: Now, here create a New Measure.
Step 6: Change the Measure name to Target Sales and change the Formula to =SUM([Current Sales])
Step 7: Click Ok to the Power View message of Data Model has changed.
Step 8: Select Power Pivot tab and then select KPIs from the Calculations group.
Step 9: Create a New KPI from the calculation KPIs.
Step 10: Change the Absolute value to 30 which is the Target sales and then click OK.
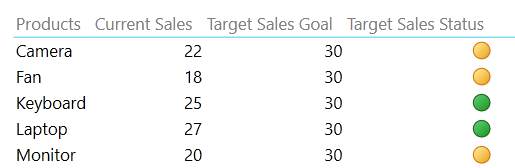
Products with current sales of less than 12 will have a status in red color, products with current sales of less than 24 will have a status with yellow color and products having less than 30 current sales will have a status in green color.
Step 11: A table will be created with key performance indicators.
Share your thoughts in the comments
Please Login to comment...