Power BI – Q & A
Last Updated :
25 Sep, 2023
Power BI is a powerful data visualization and analytics tool that can help you quickly make sense of your data by extracting it from different data sources.
In this article, we will learn to implement the Q&A feature of Power BI. It is a form of question-and-answer tool to explore data and create visuals for report analysis. It uses natural language to explore data.
Pre-requisite: You can refer to Power BI interactive dashboards for easy implementation of the charts.
About Q&A
- The easiest way to get answers from your data is to perform a search over data using natural language. It is free and available to all users.
- It has the ability to understand the core natural language that works across your data.
- It has the ability to do context-dependent keyword searches for any table or dataset.
- It has a built-in feature for filtering, aggregating, sorting, grouping, and displaying data.
- Questions are generally asked based on data fields.
For example, Mobile apps support Q&A
Uses of Power BI Q&A
- It is used to explore data in the user’s own words using natural language.
- It is used to explore the datasets and build visualizations for reporting.
- It is used to view certain data trends for business needs.
- One question leads to another showing some interesting analytical paths.
- It searches structured data and accordingly chooses the relevant visualization for the user’s question.
- It is used to share reports based on asking easy questions and getting quality answers.
- Report designers use it heavily for exploring data and creating visuals.
Dataset used:
The dataset used is “SaleData“. Upload the dataset in Power BI and refer to the dataset to follow along with the below-given sections of the article.
.png)
Steps to follow
1. Open Power BI desktop. Load Data in Power BI Desktop.
-(1).png)
2. Click the “Get Data” option and select “Excel” for data source selection and extraction.
.png)
3. Select the relevant desired file from the folder for data load. In this case, the file is “SaleData.xls”. click the “Load” button once the preview is shown for the Excel data file.
.png)
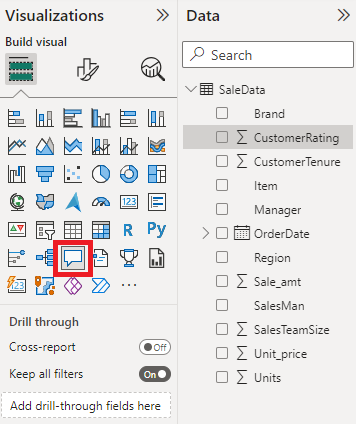
4. The dashboard is seen once the file is loaded with the “Visualizations” Pane and “Data fields” Pane which stores the different variables of the data file.
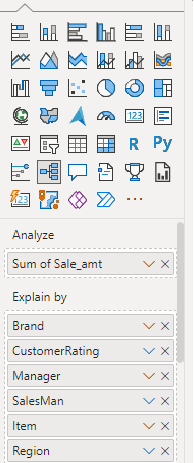
5. Select Q & A icon from the visualizations pane, it’s the third icon of the second last row.
6. A Q&A question box appears on the canvas. When you place your cursor in the question box it displays suggestions to help the user.
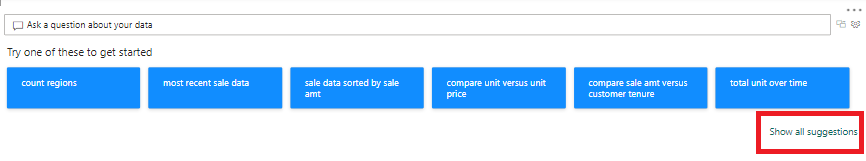
7. As the user types questions, it displays a nice visualization for providing the answer.
.png)
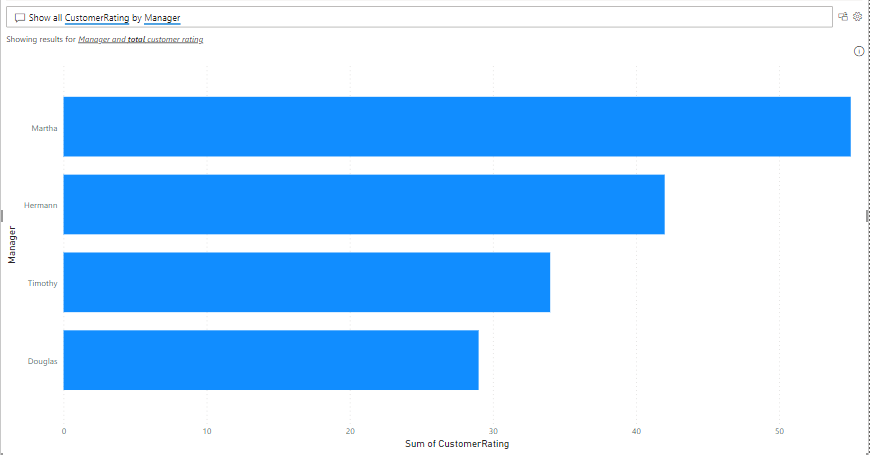
8. The visualization gets changed depending on the questions. The following shows the result to the question “Show all customer ratings by manager”
9. Another Q&A is “Show Sale_amt by region”
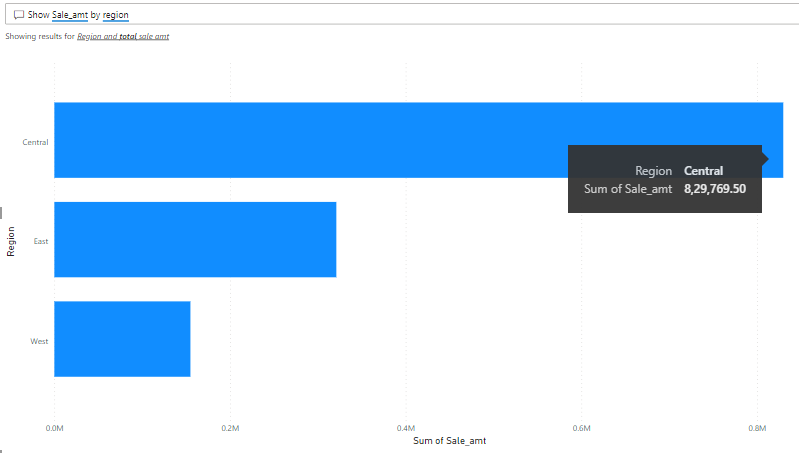
10. The user can hover on any element for viewing the result in detail.
.png)
11. This shows visuals for other hover-over items.
.png)
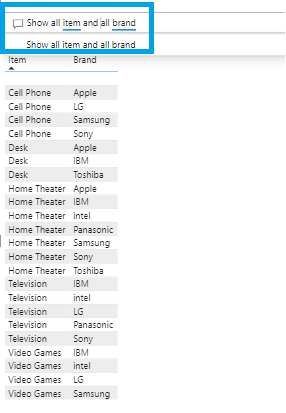
12. This shows all items and brands at one time, The user can choose to display in any order.
13. This shows the items and brands in the focus mode.
.png)
14. Different visualizations can be saved by using “More options” in the top right corner.
.png)
Conclusion
It is very interactive and fun with good formatting features. It can also tell Power BI how to display the answer. Q & A needs to be enabled while connecting with live connections.
Note:
- To check if Power BI recognizes some keywords, type some keywords in the question box. The greying out shows that it does not recognize it.
- Make Excel data work well with Q& A.
- Q & A tool depends on the name of the table, data fields, and columns. Make sure the names make sense in the natural speech.
- The most common keywords are total, sum, minimum, maximum, number, quantity, count, largest, smallest, highest, greatest, equal to, between, and before.
Share your thoughts in the comments
Please Login to comment...