Plotting polar curves in Python
Last Updated :
22 Jun, 2020
A point in polar co-ordinates is represented as (r, theta). Here, r is its distance from the origin and theta is the angle at which r has to be measured from origin. Any mathematical function in the Cartesian coordinate system can also be plotted using the polar coordinates.
Modules required
- Matplotlib : Matplotlib is a comprehensive Python library for creating static and interactive plots and visualisations. To install this module type the below command in the terminal.
pip install matplotlib
- Numpy : Numpy is the core library for array computing in Python. To install this module type the below command in the terminal.
pip install numpy
- math : math is a built-in module used for performing various mathematical tasks.
The matplotlib.pyplot module contains a function polar(), which can be used for plotting curves in polar coordinates.
Syntax : matplotlib.pyplot.polar(theta, r, **kwargs)
Parameters :
- theta – angle
- r – distance
Approach :
In each of the examples below,
- A list of radian values is created. These values cover the domain of the respective function.
- For each radian value, theta, a corresponding value of r is calculated according to a specific formula for each curve.
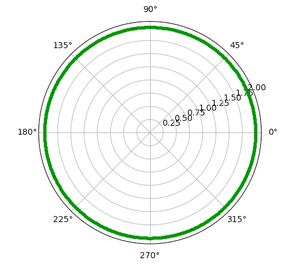
1. Circle : A circle is a shape consisting of all points in a plane that are a given distance(radius) from a given point, the centre. Hence, r is a constant value equal to the radius.
Example :
Python3
import numpy as np
import matplotlib.pyplot as plt
plt.axes(projection = 'polar')
r = 2
rads = np.arange(0, (2 * np.pi), 0.01)
for rad in rads:
plt.polar(rad, r, 'g.')
plt.show()
|
Output :
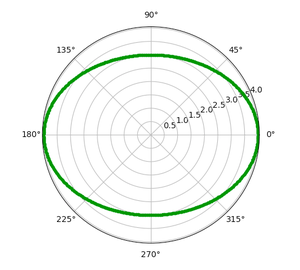
2. Ellipse : An ellipse is the locus of a point moving in a plane such that the sum of its distances from two other points (the foci) is constant. Here, r is defined as :

Where,
- a = length of semi major axis
- b = length of semi minor axis
Example :
Python3
import numpy as np
import matplotlib.pyplot as plt
import math
plt.axes(projection = 'polar')
a = 4
b = 3
rads = np.arange(0, (2 * np.pi), 0.01)
for rad in rads:
r = (a*b)/math.sqrt((a*np.sin(rad))**2 + (b*np.cos(rad))**2)
plt.polar(rad, r, 'g.')
plt.show()
|
Output :
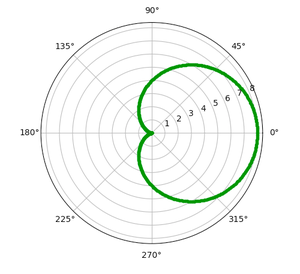
3. Cardioid : A cardioid is the locus of a point on the circumference of a circle as it rolls around another identical circle. Here, r is defined as :

Where, a = length of axis of cardioid
Example :
Python3
import numpy as np
import matplotlib.pyplot as plt
import math
plt.axes(projection = 'polar')
a=4
rads = np.arange(0, (2 * np.pi), 0.01)
for rad in rads:
r = a + (a*np.cos(rad))
plt.polar(rad,r,'g.')
plt.show()
|
Output :
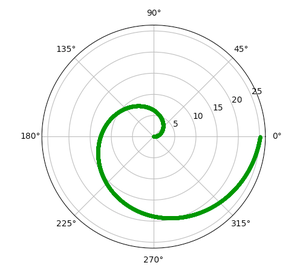
4. Archimedean spiral : An Archimedean spiral is the locus of a point moving uniformly on a straight line, which itself is turning uniformly about one of its end points. Here, r is defined as :

Example:
Python3
import numpy as np
import matplotlib.pyplot as plt
plt.axes(projection = 'polar')
rads = np.arange(0, 2 * np.pi, 0.001)
for rad in rads:
r = rad
plt.polar(rad, r, 'g.')
plt.show()
|
Output :
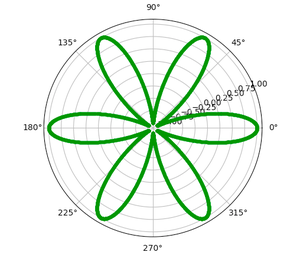
5. Rhodonea : A Rhodonea or Rose curve is a rose-shaped sinusoid plotted in polar coordinates. Here, r is defined as :

Where,
- a = length of petals
- n = number of petals
Example:
Python3
import numpy as np
import matplotlib.pyplot as plt
plt.axes(projection='polar')
a = 1
n = 6
rads = np.arange(0, 2 * np.pi, 0.001)
for rad in rads:
r = a * np.cos(n*rad)
plt.polar(rad, r, 'g.')
plt.show()
|
Output :
Share your thoughts in the comments
Please Login to comment...