How to plot Andrews curves using Pandas in Python?
Last Updated :
21 Mar, 2024
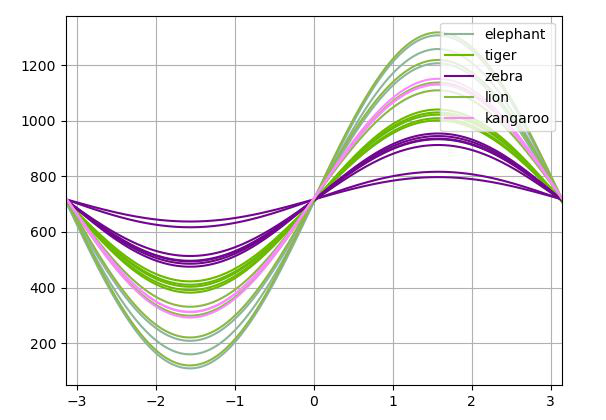
Andrews curves are used for visualizing high-dimensional data by mapping each observation onto a function. It preserves means, distance, and variances. It is given by formula:
T(n) = x_1/sqrt(2) + x_2 sin(n) + x_3 cos(n) + x_4 sin(2n) + x_5 cos(2n) + …
Plotting Andrews curves on a graph can be done using the andrews_curves() method of the plotting module. This function generates a matplotlib plot of Andrews curves, for visualising clusters of multivariate data.
Syntax: andrews_curves(frame, class_column, ax=None, samples=200, color=None, colormap=None, **kwargs)
Parameters:
- frame: It is the data to be plotted.
- class_column: This is the name of the column containing class names.
- ax: This parameter is a matplotlib axes object. Its default value is None.
- samples: This parameter is the number of points to plot in each curve.
- color: This parameter is an optional parameter and it is the list or tuple of colors to use for the different classes.
- colormap: This parameter is the string/matplotlib colormap object. Its default value is None.
Returns: This function returns an object of class matplotlib.axis.Axes
Example 1: In the following example, A data frame is made from the CSV file and the data frame is used to plot andrews_curves.
Python3
import pandas as pd
import numpy as np
import matplotlib.pyplot as plt
df = pd.read_csv(
'C:\\Users\\digital india\\Desktop\\pand.csv'
)
x = pd.plotting.andrews_curves(df, 'animal')
x.plot()
plt.show()
|
Output:

Example 2:
Python3
import pandas as pd
import numpy as np
import matplotlib.pyplot as plt
df = pd.read_csv(
'pandas/master/pandas/tests/io/data/csv/iris.csv'
)
x = pd.plotting.andrews_curves(df, 'Name')
x.plot()
plt.show()
|
Output:

Share your thoughts in the comments
Please Login to comment...