Plotting In A Non-Blocking Way With Matplotlib
Last Updated :
14 Dec, 2023
When we plot a graph with Matplotlib, by default the execution of the code is stopped/blocked when it is viewed/drawn until the view window is closed. However, in certain cases, one may want to remove this blocking behavior and see the graph as soon as it is plotted or updated without blocking the program execution. This article addresses this issue by showing how to plot with Matplotlib in a non-blocking way.
Note: This article assumes that the matplotlib.pyplot has been imported as plt. Hence, plt refers to matplotlib.pyplot everywhere in this article.
Plotting with Matplotlib in a non-blocking way
Plotting with Matplotlib such that the execution of the program is not halted on showing the graph window is called plotting in a non-blocking way. This may be required in several situations like plotting in an interactive console where one wants to plot the next graph only after having a look at the previous one, one wants to update the graph based on data, etc. In this section we will look at three ways to plot with Matplotlib in a non-blocking way –
- Using the “block” argument of plt.show() function.
- Using the plt.pause() function.
- Using the pyplot interactive mode (plt.ion()).
Using block argument of plt.show() function
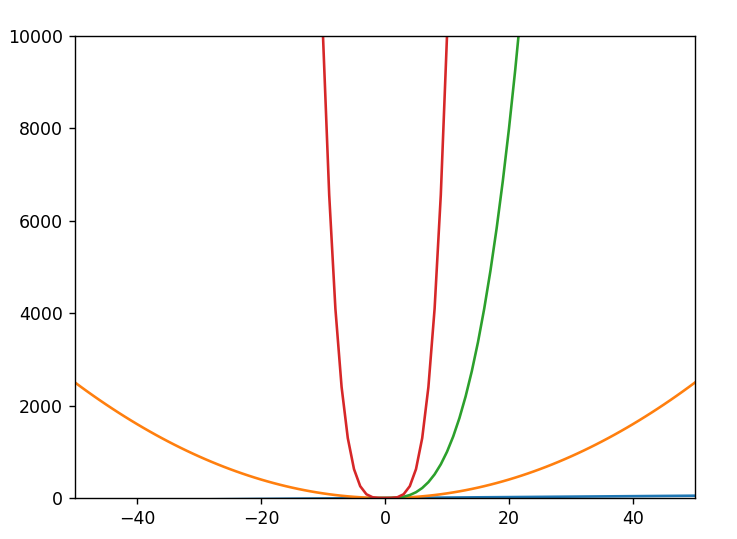
In this approach, every time you want to see/update the plot, call the plt.show() function with the “block=False” argument. This will draw the latest updates on the window but not block the execution of the program afterward. After drawing the final graph, just call the plt.show() function without any arguments to halt the execution of the program at the point (because the program and hence the window will exit otherwise). This is demonstrated in the following example code –
Python3
import numpy as np
import matplotlib.pyplot as plt
def main():
plt.axis([-50, 50, 0, 10000])
x = np.arange(-50, 51)
for power in range(1, 5):
y = [x_i ** power for x_i in x]
plt.plot(x, y)
plt.draw()
plt.pause(0.001)
input("Press [Enter] to proceed to the next plot.")
if __name__ == '__main__':
plt.ion()
plt.show(block=False)
main()
|
Output:
Using plt.pause() function
In this approach, when you want to show/update the plot, call the “plt.pause(n)” function where n is a decimal number denoting pause time in seconds. After the final plot, call the plt.show() function though because you would probably like to block the execution at this point otherwise the program would exit and so would the graph window. This is demonstrated with the following example –
Python3
import numpy as np
from matplotlib import pyplot as plt
def main():
plt.axis([-10, 10, -10, 10])
plt.ion()
plt.show()
x = np.arange(-10, 11)
for function_name in ["Linear", "Quadratic", "Cubic", "Square Root"]:
if function_name == "Linear":
y = x
elif function_name == "Quadratic":
y = x**2
elif function_name == "Cubic":
y = x**3
elif function_name == "Square Root":
y = np.sqrt(np.abs(x))
plt.plot(x, y, label=function_name)
plt.draw()
plt.pause(0.001)
input("Press [enter] to continue.")
if __name__ == '__main__':
main()
|
Output:
.gif)
Note that the graph gets updated before each pause. Moreover, we have used 1 second as the pause time for demonstration. One can make the pause time smaller (like 0.01 seconds) to reduce the pause time.
Using the pyplot interactive mode (plt.ion())
In this approach, we turn on the interactive mode of pyplot using plt.ion(). Once the interactive mode is turned on the plotting environment automatically gets into non-blocking mode and every time an update is made to the figure, it is instantly drawn. After all the plotting is done, it is recommended to turn off the interactive mode using plt.ioff() and then call plt.show() to block the program otherwise the program would exit and so would the matplotlib figure. This is demonstrated through the following example –
Python3
import matplotlib.pyplot as plt
import numpy as np
def plot_power(x, power):
y = x ** power
plt.plot(x, y)
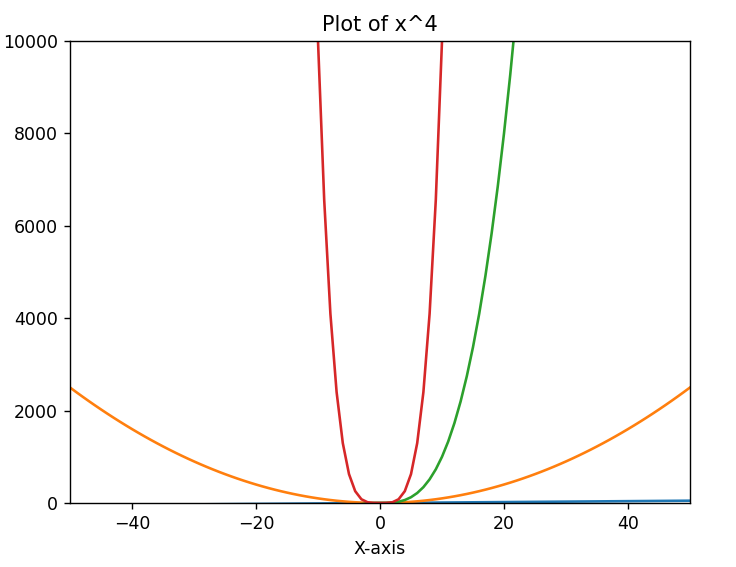
plt.title(f'Plot of x^{power}')
plt.xlabel('X-axis')
plt.ylabel('Y-axis')
plt.draw()
plt.pause(0.5)
def main():
x = np.arange(-50, 51)
powers = [1, 2, 3, 4]
plt.axis([-50, 50, 0, 10000])
plt.ion()
for power in powers:
plot_power(x, power)
input(f'Press [Enter] to proceed to the next plot (x^{power}).')
plt.ioff()
plt.show()
if __name__ == '__main__':
main()
|
Output:
Conclusion
We saw three different methods to plot in matplotlib in a non-blocking way. By default, the matplotlib has blocking behavior i.e., when a figure is drawn, it blocks the execution of the program until the figure window is closed. Although this is a useful feature most of the time, one may sometimes need to remove this behavior and plot in a non-blocking way. When plotting in a non-blocking way, the execution is not halted/blocked when the figure is drawn and further program can be executed keeping the figure window open. This is useful in situations like updating a graph or when we want to plot next graph only after looking at the previous one, etc.
Share your thoughts in the comments
Please Login to comment...