Python | Matplotlib Sub plotting using object oriented API
Last Updated :
25 Jul, 2019
Plotting using Object Oriented(OO) API in matplotlib is an easy approach to plot graphs and other data visualization methods.
The simple syntax to create the class and object for sub-plotting is –
class_name, object_name = matplotlib.pyplot.subplots(‘no_of_rows’, ‘no_of_columns’)
Let’s take some examples to make it more clear.
Example #1:
import matplotlib.pyplot as plt
x =[0, 1, 2, 3, 4, 5, 6]
y =[0, 1, 3, 6, 9, 12, 17]
fig, axes = plt.subplots(1, 2)
axes[0].plot(x, y, 'g--o')
axes[1].plot(y, x, 'm--o')
fig.tight_layout()
|
Output :
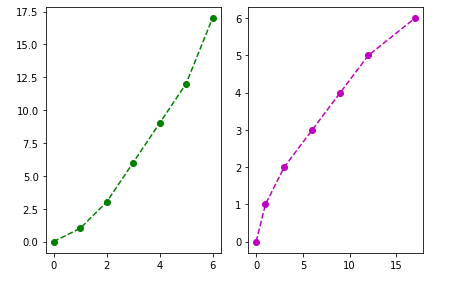
In the above example, we used ‘axes'(the object of the class ‘fig’) as an array at the time of plotting graph, it is because when we define the number of rows and columns then array of the objects is created with ‘n’ number of elements where ‘n’ is the product of rows and columns, so if we have 2 columns and two rows then there will be array of 4 elements.
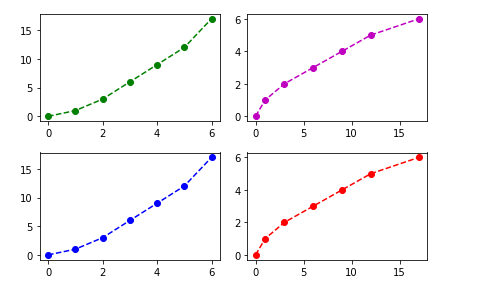
Example #2:
import matplotlib.pyplot as plt
x =[0, 1, 2, 3, 4, 5, 6]
y =[0, 1, 3, 6, 9, 12, 17]
fig, axes = plt.subplots(2, 2)
axes[0, 0].plot(x, y, 'g--o')
axes[0, 1].plot(y, x, 'm--o')
axes[1, 0].plot(x, y, 'b--o')
axes[1, 1].plot(y, x, 'r--o')
fig.tight_layout()
|
Output :
Share your thoughts in the comments
Please Login to comment...