Noise Figure
Last Updated :
19 Mar, 2024
Often while dealing with signals in electronics and communication systems, we encounter distortion in signals due to noise. Noise is an unwanted disturbance that can attenuate our signal which disrupts making it difficult to study the signals. In this article, we will study the noise figure which is an important instrument used for measuring the quality of signals.
Later, we will understand the work behind calculating the noise figure. Through a diagram, we will also see the formula used for calculating noise figures with a physical understanding of the formula. Some solved examples have been provided to enhance the understanding of readers about the topic. We will look at the advantages, disadvantages, and applications of noise figures in the real world. In the end, we will conclude the article with some frequently asked questions that readers can refer to
The noise figure is an important concept that is used to study the deterioration in the received signals due to noise. During the propagation of a signal, it can be affected by noises it encounters in the travelling medium. These noises can not only disrupt the original signal but also make it difficult to obtain the actual message without any errors. A lower noise figure indicates a better-performing device because it adds less noise than a device with a higher noise factor.
Definition
Let us now see a formal definition of the noise figure
The noise figure of a system is defined as the ratio of the signal-to-noise power ratio at the input to the signal-to-noise power ratio at the output. It is a tool for measuring the degradation in noise.
Noise Figure is used to measure the amount of disruption in signal due to noise. Let us see the principle used behind calculating the noise figure.
The main principle used for measuring noise figures is measuring how the power is distributed in a system at the input and the output sides. The Signal to Noise ratio of devices is a mathematical concept that helps in analyzing the power distribution. The SNR provides information regarding the ratio of the power of the signal to the power of the noise.
The output power will always be less than or equal to the input power depending on how much noise was present and how much signal was disrupted. This SNR is then used for analyzing the effect of noise and making changes in the system to minimize this signal loss. We can quantify the degradation of signal due to noise using a noise figure. Noise Figure is then used to study different devices and compare them based on the values of Noise Figure.
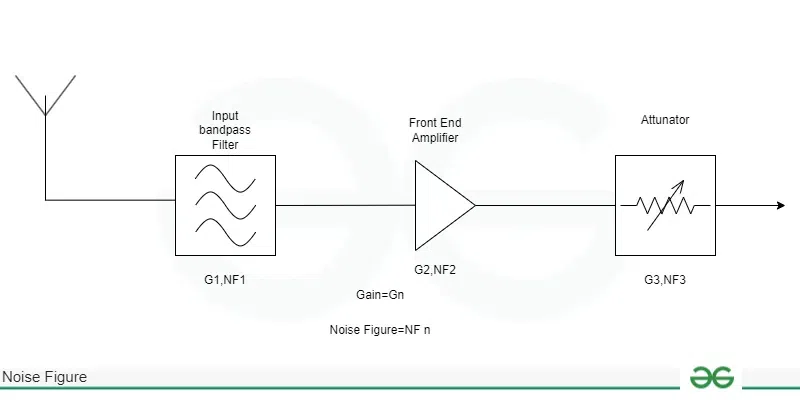
Using the diagram, it is possible to determine the noise figure formula from the conditions described above. G will be 0 for the ideal system.

Circuit Diagram
N= 10 log10 (Si/Ni)/(So/No)
Where
Si is the signal at the input
Ni is the noise at the input
So is the signal at the output
No noise at the output
The noise figure of an element is a necessary parameter and various methods can be used for measuring this parameter. Let us see how
Noise Figure Measurement circuit
The basic step before using any device is to send an input signal to the device. The final value of the noise figure is generated by certain instruments some of which have been mentioned below
- Noise figure measurement meter: A meter is designed in laboratories that calculate the noise figure of a given system and the signal associated with the system. These devices are necessary tools since they are efficient and easy to use. In addition to this, they provide accurate results.
- Noise figure analyzers: These are devices that provide a very quick and efficient method for measuring the noise figure of an item. They are an ideal choice mainly because of the accurate results they can provide with minimum error.
- Spectrum analyzer: It is another practical device that is useful for measuring noise figures. The built-in circuit of this device makes it easy to predict the noise figure.
Let us see the solved examples of Noise Figure.
Example 1
If each stage had a gain of 15db and a Noise Figure of 12db then the overall Noise Figure of the two-stage cascade amplifier would be
For a cascaded system, we can calculate the noise figure as
∴ Fn= F1+ (F2-1)/G1+ (F3-1)/G1G2 +………………………………….+(Fn-1)/(G1G2……….Gn)
For two stage amplifier n=2
∴ F2= F1+ (F2-1)/G1
For each stage gain=15db and noise figure(F)= 12db
Overall noise figure F=12+ (12-1)/15 =12.733 db
Example 2
The noise level of 10db is how many times more powerful than the noise level of 1db?
The noise level in db is given by
→ 10 Log10(Noise in Watts)
For 10db
→ 10 db=10 Log10(Noise in Watts)
→ Noise in Watts = 101
For 1db
→ 1 db= 10 Log10(Noise in Watts)
→ Noise in Watts = 100.1=1.26
Therefore
∴ P1/P2= 10/1.26= 7.94
Let us see the applications of Noise Figure :
- Noise Figure is used in communication systems to quantify the effect of noise. SNR is used to study the degradation whereas Noise Figure is used to quantify this degradation and understand the performance of different systems.
- Noise Figure is used in satellite communication. Since noise figures can help to compare the effect of noise in a system, it is often used to study how reliable a satellite is for long-distance communication from Earth to space and vice-versa.
- Noise Figure is used in medical imaging in hospitals. This involves using them in MRI and ultrasound where machines are used to detect even small weak signals generated by the human body.
- Noise Figure is used in different scientific instruments like spectrum analyzers, oscilloscopes, and particle detectors. Noise Figure is made minimum to control the sensitivity of these devices.
- Noise Figure is used in optical communication and radio frequency communication. The receivers used in optical communication are sensitive therefore noise figure is used to study how accurately these devices can generate signals.
Let us see the advantages of Noise Figure :
- Noise Figure helps to optimize the performance of various devices. A lower Noise Figure indicates that the signal is less degraded. This eventually leads to higher signal quality in devices which is the ideal choice in communication systems.
- A low Noise Figure helps to make the system more reliable and intelligible. This is done by reducing the errors per bit in a digital communication system and maintaining the quality of the signal.
- Noise Figure is used to enhance the sensitivity in devices that need to detect even small signals. Low noise figure signals are useful since they help detect weaker signals improving the overall sensitivity.
- The introduction of the Noise Figure helps to design a cost-efficient system. Components that have low noise Figures are used since they can produce desired results without any issues.
- A lower noise Figure can lead to an energy-efficient system. Systems that have high noise figures can require extra energy to obtain the original signal. Therefore, a low noise figure is preferred to minimize the energy requirement.
let us see the disadvantages of Noise Figure
- An increased Noise figure is undesirable but for achieving a low noise figure, complex components are required that can increase the overall complexity of the circuit.
- Devices with low noise Figures are quite expensive due to their ability to prevent signal deterioration therefore involving components with low noise figures can increase the overall cost of the circuit.
- The Noise Figure method becomes unreliable because the Noise Figure is dependent on certain environmental factors like temperature, humidity, and other fields. Any variation in the environment will lead to fluctuations in the noise figure of the device giving inconsistent results.
- Noise Figure calculation is a tedious task. It involves certain special tests which are complex and method-specific. The verification can also be a difficult task which makes scientists choose other methods for performance analysis.
- Noise Figure is suitable only for new components. Over some time, devices begin to age leading to their wear and tear. Therefore, we can’t use noise figures in the long run.
Conclusion
We have seen how crucial noise is in telecommunication engineering. The quality of the signal is greatly affected by noise generated during the transmission of the signal and the noise figure is a parameter that was introduced in this article to analyze the quality of the signal.
We have already studied how to study noise factors and even seen the formulas associated with the calculation of noise figures. We have also seen the circuit used for the calculation of the noise figure. Some solved examples have been provided which help readers to grasp the concept well. We have also discussed what are the advantages and disadvantages of calculating the noise figure of devices. Readers are advised to go through the FAQs section in case of any doubts.
What are some other methods used for measuring the performance of noise in communication systems?
Other than the Noise Figure, we can use the Noise Factor, Signal-noise ratio (SNR), Noise Temperature and intermodulation distortion can be used for characterizing noise performance.
What is the difference between noise figure and noise factor?
The noise factor is the ratio of the output signal-to-noise ratio to the input signal-to-noise ratio. The noise figure is a logarithmic representation of the noise factor, expressed in decibels (dB).
Does temperature affect the noise figure?
Yes, the temperature does impact the noise figure. The noise figure increases as temperature increases making the signal worse with increased noise. This is mainly because the thermal noise is proportional to temperature.
Share your thoughts in the comments
Please Login to comment...