Name and Rename Attributes in Pandas
Last Updated :
08 Dec, 2023
In the world of data science and analysis, the Pandas library in Python plays a crucial role that cannot be neglected when we talk about data manipulation and exploration. Data frames and series are the core structures of the Pandas library. Data frames are used to describe 2-dimensional data structures similar to a spreadsheet or SQL table, on the other hand, the Series is equally important, representing a single column of data. An oft-overlooked aspect of a pandas Series is its name attribute, which can be quite handy in certain scenarios. In this article, we will dive deep into the Pandas series to understand the uses of name() in the Pandas series.
Name Attributes in Pandas
Uses of name attribute in Pandas series
The name attribute is more than just a label. Here are some of its key uses:
- Used in Identification: When working with multiple Series, especially after splitting a data frame or when plotting data, the “name” attribute helps in identifying the source or nature of the data.
- Used in Reintegration into data frames: If we extract a Series from a data frame and later wish to merge it back, the “name” serves as a potential column name.
- Used in Plotting: When visualizing data, the “name” of a Series can automatically be used as a label, aiding in clarity and understanding.
Let’s see some examples of using name attributes in Pandas.
Create a named series using Pandas in Python
In the below example, we have created a simple Pandas series using series() method and named it “Numbers” with the help of “name” attribute.
Python3
import pandas as pd
s = pd.Series([1, 2, 3, 4, 5], name="Numbers")
print(s)
|
Output
0    1
1    2
2    3
3    4
4    5
Name: Numbers, dtype: int64
Extracting a Series from Data frame using Name
In the example below, we created a data frame and then extracted the ‘Age’ column. The resulting Series takes on the column name “Age” and then print the result.
Python3
import pandas as pd
df = pd.DataFrame({
'Age': [28, 35, 42, 99, 87],
'Name': ['Allen', 'Ravindra', 'Henry', 'Keshav', 'Shami']
})
age_series = df['Age']
print(age_series)
|
Output
0    28
1    35
2    42
3    99
4    87
Name: Age, dtype: int64
Renaming a Series in Pandas
Over time, we might need to rename a Series to better understand the data or to analyze the data. It can be done simply by using the rename() method of Pandas module. In the below example, we have rename the series in the above example from “Age” to “Ages”.
Python3
import pandas as pd
df = pd.DataFrame({
'Age': [28, 35, 42, 99, 87],
'Name': ['Allen', 'Ravindra', 'Henry', 'Keshav', 'Shami']
})
age_series = df['Age']
renamed_series = age_series.rename("Ages")
print(renamed_series)
|
Output
0    28
1    35
2    42
3    99
4    87
Name: Ages, dtype: int64
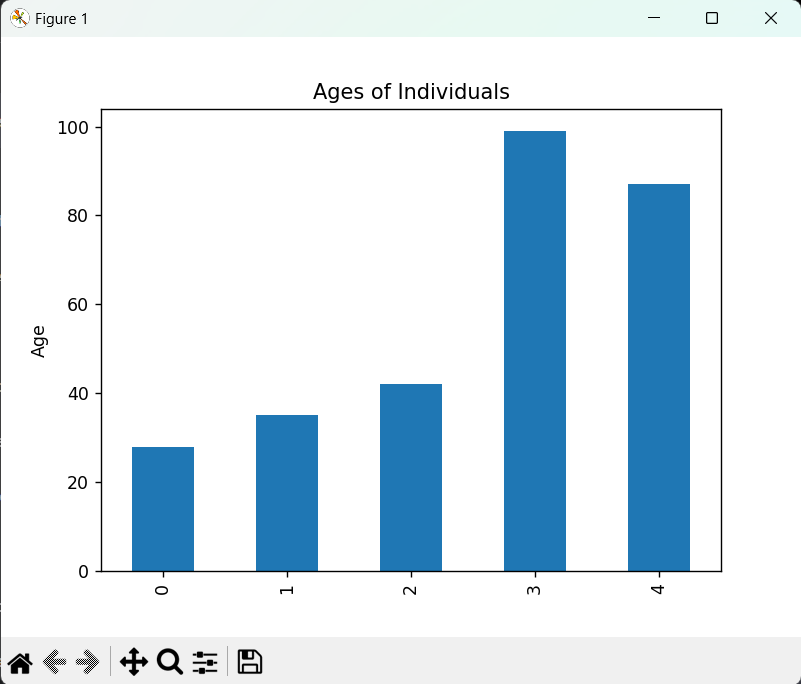
Utilizing the Name in Plots
When visualizing a data using plots, the name of a Series can be very handy as it’s automatically used as a label. Here, we’ve plotted a simple bar chart of our age_series. By referring to age_series.name for the y-label, we’ve ensured that even if the Series gets renamed, our code remains consistent and automatically updates the label.
Python3
import pandas as pd
import matplotlib.pyplot as plt
df = pd.DataFrame({
'Age': [28, 35, 42, 99, 87],
'Name': ['Allen', 'Ravindra', 'Henry', 'Keshav', 'Shami']
})
age_series = df['Age']
renamed_series = age_series.rename("Ages")
age_series.plot(kind='bar')
plt.title("Ages of Individuals")
plt.ylabel(age_series.name)
plt.show()
|
Output
Share your thoughts in the comments
Please Login to comment...