Matplotlib Pyplot API
Last Updated :
18 Oct, 2023
Data visualization plays a key role in data science and analysis. It enables us to grasp datasets by representing them. Matplotlib, a known Python library offers a range of tools, for generating informative and visually appealing plots and charts. One outstanding feature of Matplotlib is its user-versatile interface called Pyplot API, which simplifies the process of creating plots. In this article, we will learn about Matplotlib Pyplot API in Python.
Prerequisite
- Python Matplotlib
- Pyplot
- Figure and Axes: In Matplotlib a figure serves as the container, for all components of a plot while axes represent the plotting area within a figure. It is possible to have subplots within a figure.
- Types of Plots: Matplotlib Pyplot offers support for plot types, such as line plots, scatter plots, bar plots, histograms and more. Each type of plot is suitable for kinds of data and analysis purposes.
Getting Started with Matplotlib Pyplot Api
Step 1: Import Matplotlib
In this step, we are importing matplotlib that we will use in further steps.
import matplotlib.pyplot as plt
Step 2: Create Data
To visualize your desired data start by preparing it. This can include organizing a list of values, arrays or importing data from a source, like a CSV file.
Step 3: Create a Figure and Axes
Now, create a figure and axes; for your plot using the plt.subplots() function. This will provide you with the framework to create your representation.
fig, ax = plt.subplots()
Step 4: Plot Your Data
Create a representation of your data by choosing the plot type, such, as a line plot or scatter plot. Utilize the respective Pyplot function to generate your desired plot.
ax.plot(x_data, y_data, label='Data')
Step 5: Enhance Your Plot
In this step,.enhance your plot; labels, titles, legends and additional annotations to create an visually appealing visualization.
ax.set_xlabel('X-axis Label')
ax.set_ylabel('Y-axis Label')
ax.set_title('Title')
ax.legend()
Step 6: View or Store The Plot
Use plt.show() to display it in a window or utilize plt.savefig(‘plot.png’) to save it as an image.
plt.show()
Different Types of Plot
|
Barh Plot
|
It makes a horizontal bar plot.
|
|
Scatter Plot
|
It makes a scatter plot of x vs y.
|
|
Bar Plot
|
It will create a bar plot.
|
|
Histograms
|
Plot a histogram
|
|
Pie Charts
|
It plot a pie chart.
|
|
Boxplot
|
It makes a box plot.
|
|
Heatmaps
|
It makes a heatmap.
|
|
Stem Plot
|
It create a stem plot.
|
Different Types of Figure Functions
|
Figure
|
It create a new figure
|
|
Savefig
|
It is used to save the current figure
|
|
Show
|
It is used to display the figure
|
|
Close
|
It is used to close the window of the figure
|
|
Figtext
|
It is used to add text to the figure
|
Different Types of Image Functions
|
Imread
|
Used to read an image from a file into an array.
|
|
Imsave
|
Used to save an array in an image file.
|
|
Imshow
|
Used to display the image on the axes.
|
Different Varieties of Axis Functions
|
Axes
|
Used to add axes.
|
|
Text
|
Used to add text to the axes.
|
|
Title
|
Used to set a title of the current axes.
|
|
Ylabel
|
Used to set the y-axis label
|
|
Xlabel
|
Used to set the x-axis label
|
|
XScale
|
Used to set the scaling of the x-axis
|
|
YScale
|
Used to set the scaling of the y-axis
|
|
XLim
|
Used to get or set the x-limits
|
|
YLim
|
Used to get or set the y-limits
|
|
XTicks
|
Used to get or set the x-limits of the current tick locations and labels
|
Code Implementation Example
In object-oriented interface, a Figure can be divided into two different objects:
- Figure object
- Axes object
A Figure object can contain one or more axes objects. One axes represents one plot inside figure. Figure class and Axes class are discussed in detail in later sections.
Example: In this example we’ll explore how to create a line graph that displays the connection, between time and temperature. We’ll assume that we have two sets of data; one for time and another, for temperature.
Python3
import matplotlib.pyplot as plt
time = [0, 1, 2, 3, 4, 5]
temperature = [25, 27, 29, 31, 28, 26]
fig, ax = plt.subplots()
ax.plot(time, temperature, marker='o', linestyle='-',
color='b', label='Temperature')
ax.set_xlabel('Time (hours)')
ax.set_ylabel('Temperature (°C)')
ax.set_title('Temperature Variation Over Time')
ax.legend()
plt.show()
|
Output:
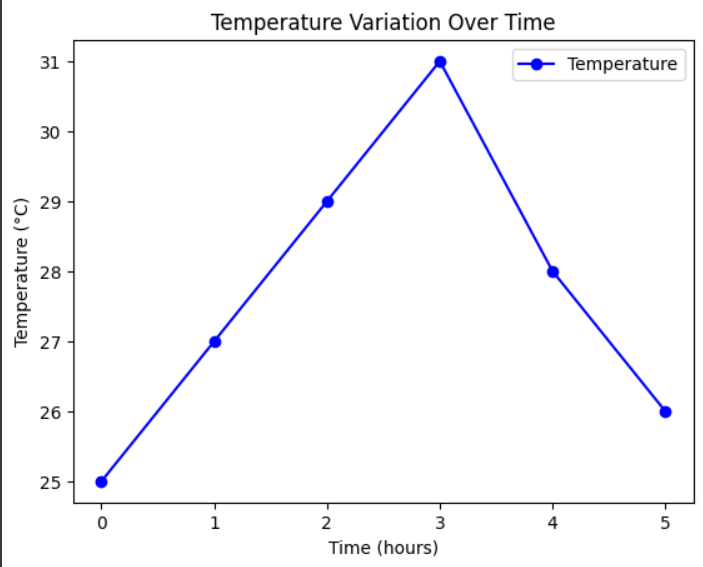
Matplotlib Line Plot
Share your thoughts in the comments
Please Login to comment...