Managing active vs inactive relationships becomes very crucial when dealing with data models that involve multiple tables and relationships in Power BI. And before we start to talk about what are active or inactive relationships and how to manage them we should first know,
What are relationships in power bi?
Relationships are referred to as connections established among different tables within the same data model. They determine how two or more tables are connected. Conceptually, relationships in Power BI are similar to joins in SQL databases.
- Relationships are essential in formulating meaningful reports or visualizations in Power BI as they ensure data integrity, provide us with accurate analysis, enable dynamic filtering, render better interactive dashboards, and enhance visualization.
- Primarily there are two types of relationships in power bi, one to many (1:N) and many to one (N:1). Additionally, power bi supports many to many (N: N) relationships also by using a bridge table. They can also be categorized as either “ACTIVE” or “INACTIVE” based on the behavior of the relationship and how it affects data filtering.
Active and Inactive Relationships in Power BI
In Power BI, active and inactive relationships signify the status of connections between tables in a data model. These concepts come into play notably in situations with multiple pathways or links between tables, providing adaptability in how these relationships are employed for various purposes within a report.
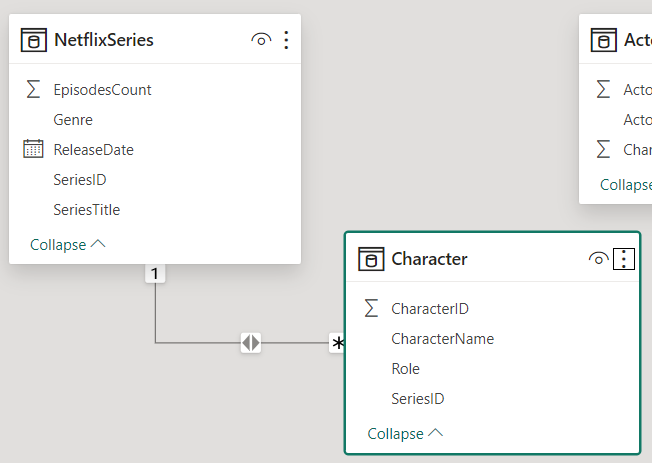
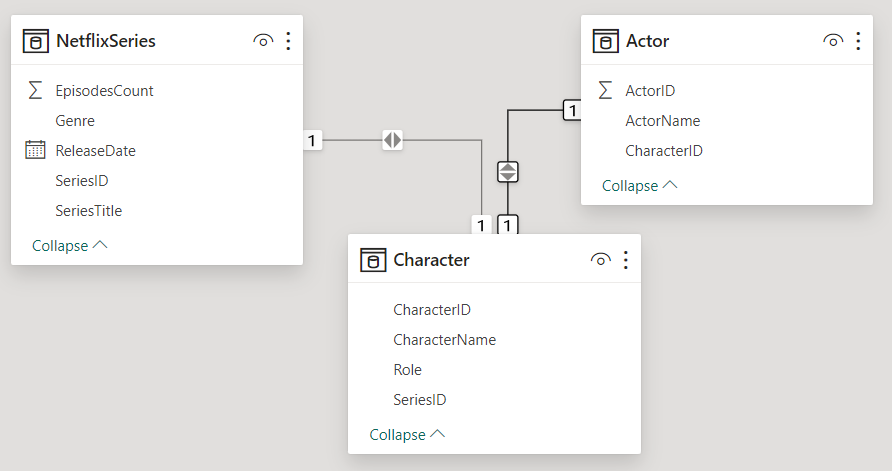
To illustrate the concept of active & inactive relationships, we’re gonna use a practical example for better clarification. Consider random data analysis for Netflix web series through three tables: ‘NetflixSeries,’ ‘Character,’ and ‘Actor.’
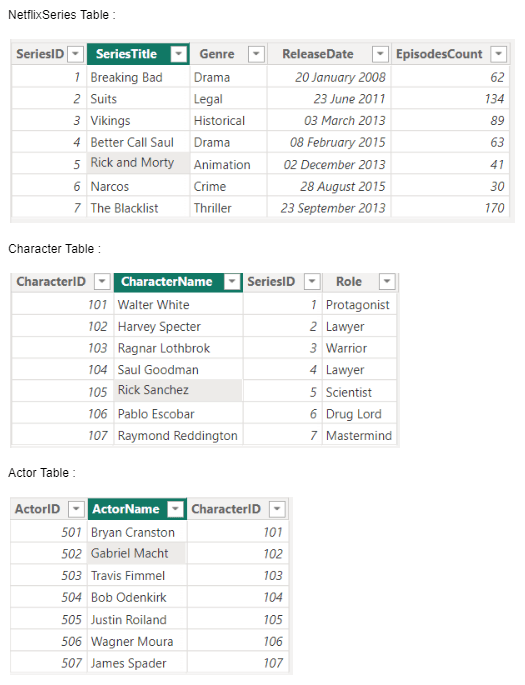
Data on tables
Active Relationship
Active relationships are created in Power BI Desktop’s “Model” view. To establish one, drag and drop a field from one table onto the corresponding field in another table. Power BI automatically detects relationships based on column names, but users can also create them manually.
- For an instance to establish an active relationship between the ‘SeriesID’ columns in the ‘NetflixSeries’ and ‘Character’ tables go to the “Model” view in Power BI Desktop and drag the ‘SeriesID’ field from the ‘NetflixSeries’ table onto the ‘SeriesID’ field in the ‘Character’ table. This active relationship allows filters applied to the ‘NetflixSeries’ table to automatically propagate to the ‘Character’ table based on the shared ‘SeriesID’.
- On deleting all the automatically existing relationships and then creating an active relationship manually the model view appears as.
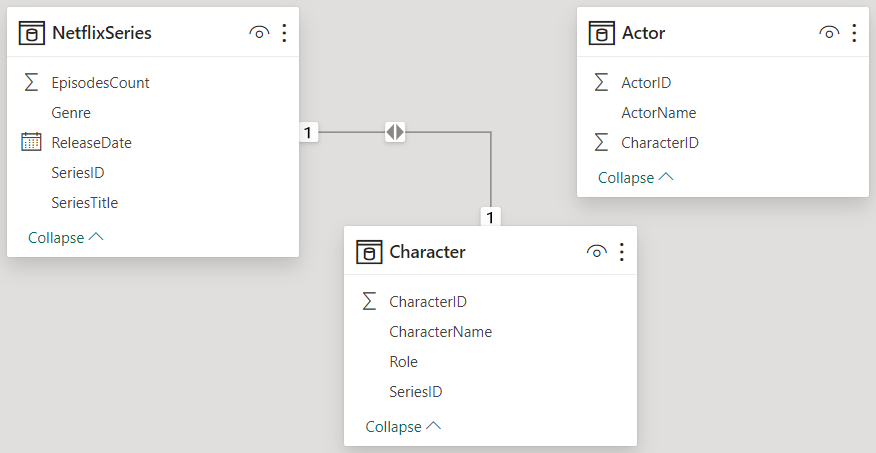
Active relationship
Note that relationship line here is a solid line between ‘NetflixSeries’ and ‘Character’ table, indicating an active relationship.
Filter Propagation
Active relationships play a crucial role in filter propagation. When a filter is applied to a field in one table, it affects the related table through the active relationship, ensuring accurate context and relationships between data tables.
To illustrate this feature of an Active Relationship go to the “Report” view. Create a table visual with columns from the ‘Character’ table. Drag the ‘SeriesTitle’ field from the ‘NetflixSeries’ table into the table visual.
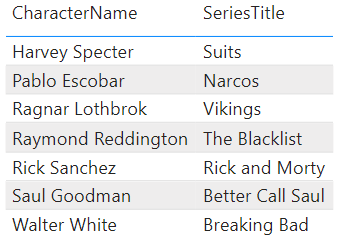
The tables synced with a perfect cadence.
Here, for basic understanding we have introduced a 1:1 active relationship therefore selections in one table may not visibly impact the other table if there’s a unique match for each row. Filter propagation might not be as noticeable due to the one-to-one nature of the relationship.
Creating 1:N active relationship
Therefore, to illustrate filter propagation better we will create a 1:N active relationship between ‘NetflixSeries’ and ‘Character’ table. For that we have to ensure that ‘SeriesID’ field in the ‘NetflixSeries’ table has unique values for each series and we will also remove any existing relationships between the ‘NetflixSeries’ and ‘Character’ tables as there can exist only one active relationship at a time.
Established 1:N relationship
Create a new column to the ‘Character’ table named ‘RelatedSeriesID’ to represent the relationship.
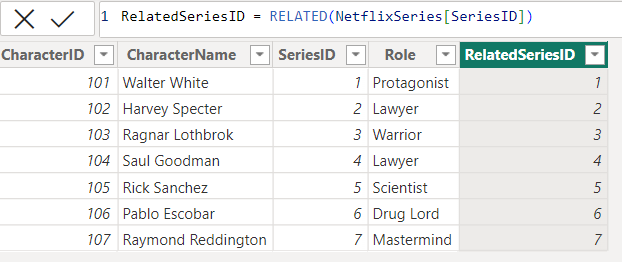
New column “RelatedSeriesID”
Navigate to “Report” View. Drag the ‘CharacterName’ and ‘[RelatedSeriesID]’ fields from the ‘Character’ table into the report canvas to create a table visual.
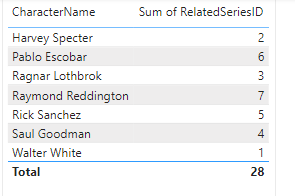
Table
Select ‘SeriesTitle’ in NetflixSeries Table. In the ‘NetflixSeries’ table, select a specific series, for example, “Suits.” Observe Filter Propagation. Observe how the ‘Character’ table adjusts dynamically based on our selection of “Suits.”
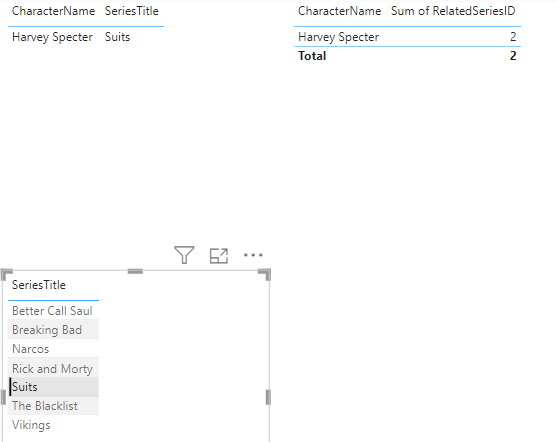
filter propagation
The ‘Character’ table should now display only characters related to the selected series, which is “Suits” in this case.
Key Characteristics of Active Relationships
- An active relationship is the primary connection between tables used for typical filtering and data analysis.
- Represented by a solid line.
- Default for regular data analysis tasks.
- Only a single active relationship can be established between each pair of tables.
- Two-way filtering impact—primary and related tables.
Inactive Relationship
In Power BI, relationships are connections between tables based on common columns. By default, each table can have one active relationship with another table. Inactive relationships are additional relationships that we create between tables but are not used by default in calculations.
- The primary purpose of inactive relationships is to handle scenarios where we have multiple relationships between two tables, and we wanna control which relationship is used in specific situations.
- This can be useful when dealing with different types of connections between tables or when we wish to switch between relationships based on certain conditions. For example, above to understand filter propagation in active relationships we removed the already existing 1:1 relationship and created another 1:N relationship as there can’t stand more than one active relationships at a time. In such scenarios we can create inactive relationships for ease and to maintain data consistency.
Suppose we want to create a report based on our very initial data model.
Model View
We want to create a report that counts the number of characters in each Netflix series, we also want a specialized count based on the actors’ roles in those characters. This scenario introduces the need for an inactive relationship. In our data model, the primary relationship is likely between the ‘NetflixSeries’ and ‘Character’ tables based on the ‘SeriesID’ column.
Creating an inactive relationship
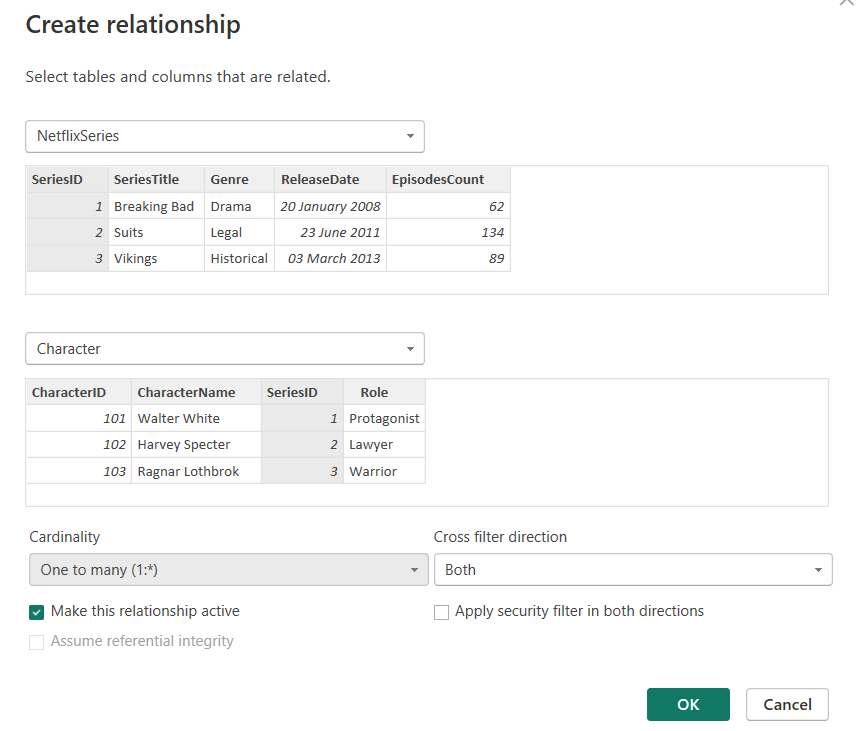
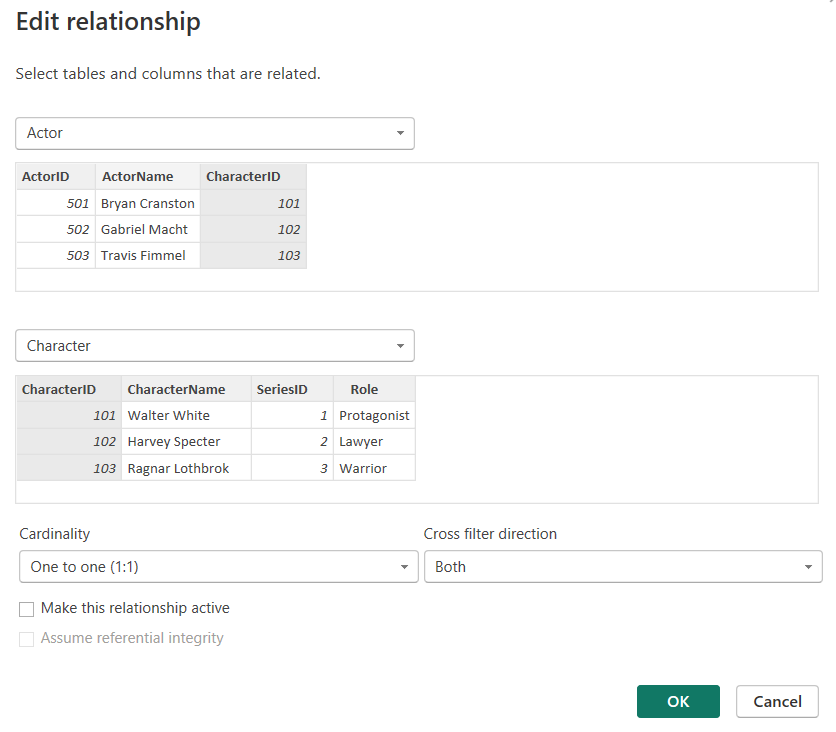
In the “Model” view, locate and click on the “Manage Relationships” button. Click on “New” to create a new relationship. In the “Create Relationship” dialog, select the Character table on left and the Actor table on right. Connect the tables based on the ‘CharacterID’ column. Before clicking “OK,” check the box that says “Mark as Inactive.” Click “OK” to create the inactive relationship.
In our scenario, we just have to unmark the active relationship box to create an inactive relationship.
creating inactive relationship
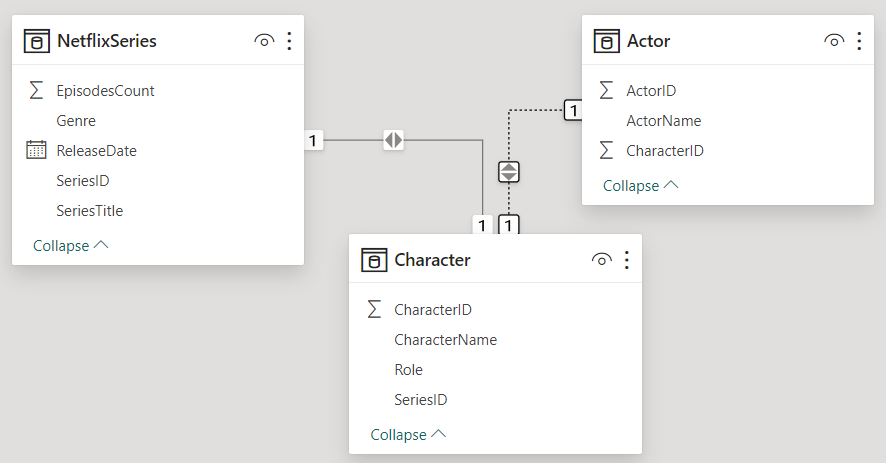
Established inactive relationship
Dotted line implies inactive relationship.
Ambiguous path & Conflicting filters problem
Inactive relationships in Power BI are a mechanism to address and resolve both ambiguous path and conflicting filters problems.
- When there are multiple relationships between two tables, Power BI may encounter ambiguity in determining which path to follow for calculations, leading to unexpected results. By marking one of the relationships as inactive, we explicitly specify that it should not be used by default for calculations.
- When creating measures, we can use the USERELATIONSHIP function to instruct Power BI to use the inactive relationship for specific calculations.
- Conflicting filters occur when filters from different tables clash, leading to unpredictable or incorrect results in our reports. Inactive relationships help manage conflicting filters by allowing us to control the direction of filter propagation. By adjusting the cross-filter direction for inactive relationships, we guide how filters flow between tables, preventing conflicts.
The USERELATIONSHIP Function
The USERELATIONSHIP function in Power BI is used to explicitly specify a relationship to be used during the evaluation of a particular DAX expression. This function allows us to override the automatic relationship detection that Power BI performs based on the relationships defined in the data model. It’s particularly useful in scenarios where there are multiple relationships between tables, and we want to control which relationship should be used for a specific calculation.
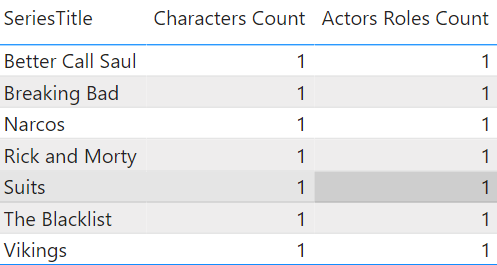
For an instance, in our scenario we took, in report view create a new measure ‘Character Count’ measure as follows using DAX formula in ‘NetflixSeries’ table:

new measure ‘Character Count’
then, create a new measure named ‘Actors Roles Count’ with the DAX formula as follows in ‘Character’ table:

new measure ‘Actor Roles Count’
In the “Report” view, create a table visual. Drag and drop the ‘SeriesTitle’ column from the ‘NetflixSeries’ table into the table visual. Add the Characters Count and Actors Roles Count measures to the “Values” area of the table visual.
repor
Key features of inactive relationships
- In an inactive relationship, filters are applied only when explicitly triggered by a DAX expression, allowing for a more precise and on-demand filtering mechanism.
- It appears as a dotted line.
- Inactive relationship filters activate through explicit DAX expressions.
- This setup permits creating alternative scenarios without affecting the primary data model and minimizes conflict risks.
- Enhanced reporting flexibility is achieved through dynamic relationship switching, valuable for independent exploration of historical data trends.
Active relationships are essential for propagating row-level security filters. Even with the explicit addition of ‘UseRelationship’ in a measure definition, such filters remain exclusive to active relationships and won’t extend to inactive ones.
Share your thoughts in the comments
Please Login to comment...