Lower Tail Test of Population Proportion in R
Last Updated :
27 Mar, 2023
A statistical hypothesis test is a method of statistical inference used to decide whether the data at hand sufficiently support a particular hypothesis. The conventional steps that are followed while formulating the hypothesis test, are listed as follows
- State null hypothesis (Ho) and alternate hypothesis (Ha)
- Collect a relevant sample of data to test the hypothesis.
- Choose a significance level for the hypothesis test.
- Perform an appropriate statistical test.
- Based on test statistics and p-value decide whether to reject or fail to reject your null hypothesis.
Generally, hypothesis testing is performed to estimate the population means and population proportion, in this article let us discuss how to perform a two-tailed population proportion test. A lower-tailed test is a one-tail test in which the critical area of a distribution is one-sided (left extreme) and tests whether a sample is less than a specified value.
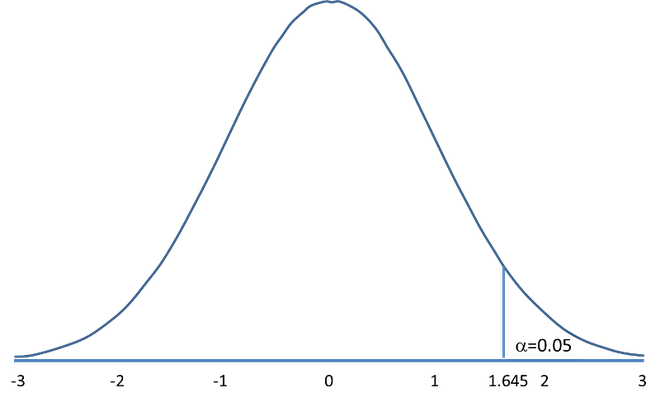
Lower tailed test with alpha = 0.05
Let us take a more realistic example, Assume 70% of students attended the Annual day function. In a survey conducted with 200 students, 133 students said they have attended the annual day function. At a 0.5 significance level, let us apply the lower tail test to check whether can we reject the null hypothesis that the proportion of students in the population is above 70%.
Null Hypothesis: The % of students who attended the Annual day function is greater than or equal to 70%. p >= po (Here, po = 0.7)
Alternate Hypothesis: The % of students who attended the Annual day function is less than 70%. pa < 0.70
alpha: 0.05
Let us define the test statistic as follows

where,
 : Sample Proportion
- p = population proportion
Let us compute the test statistic as shown below,
R
pbar = 133/200
p0 = .7
n = 200
z = (pbar-p0)/sqrt(p0*(1-p0)/n)
z
|
Output:
-1.5430335
Now let us compute the critical values,
R
alpha = .05
z.alpha = qnorm(1-alpha)
-z.alpha
|
Output:
−1.6449
From the test results, we can conclude that The test statistic -1.5430335 is not less than the critical value of -1.6449. Hence, at the 0.05 significance level, we fail to reject the null hypothesis that the proportion of students who attended the Annual day function in the population is above 70% this year.
Share your thoughts in the comments
Please Login to comment...