How to use matplotlib plot inline?
Last Updated :
29 Nov, 2023
Matplotlib is a Python library that helps in drawing graphs. It is used in data visualization and graph plotting. Matplotlib Plot Inline is a package that supports Matplotlib to display plots directly inline and save them to notebooks. In this article, we’ll cover the following:
What is Matplotlib Inline in Python?
Matplotlib’s plot() function in inline mode is a feature that allows you to display the generated plots directly within the Jupyter Notebook environment rather than in separate windows. This is particularly useful for the seamless integration of visualizations with code and results in a more interactive and cohesive data exploration experience.
To enable inline plotting in a code, we typically use the %matplotlib inline magic command. This command is placed at the beginning of the notebook and informs Matplotlib to render the plots directly below the code cells.
Advantages of Matplotlib Plot Inline
There are some advantages of Matplotlib plot inline in Python.
- Seamless Integration: Integration of visualizations directly within Jupyter Notebooks for a cohesive analysis environment.
- Readability Enhancement: Plots displayed directly below code cells improve code readability and comprehension.
- Efficient Prototyping: Immediate visualization enables rapid prototyping and quick insights during analysis.
- Distraction Reduction: Elimination of external windows minimizes distractions, maintaining focus within the notebook.
- Dynamic Interaction and Widgets: Support for dynamic interaction and interactive widgets enhances user engagement with visualizations.
Matplotlib Without inline
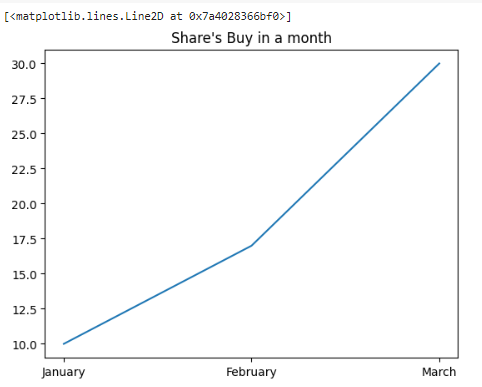
The %matplotlib inline enables “inline plotting”, where plotted graphics appear in your notebook. Suppose we want to draw a simple line graph using the following code. The code works fine, but it doesn’t show the line graph inline with the code.
Python3
import matplotlib.pyplot as plt
Month = ['January', 'February', 'March']
Share_buy = [10, 17, 30]
plt.title("Share's Buy in a month")
plt.plot(Month, Share_buy)
|
Output:
Matplotlib With Inline
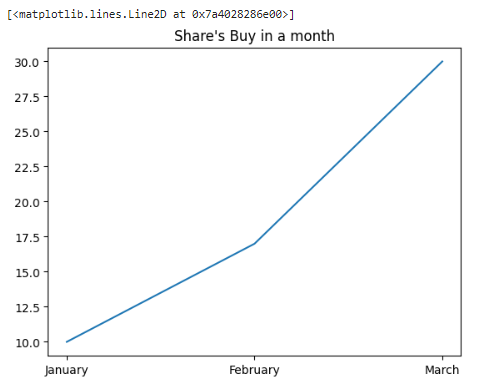
To solve the above problem, we can use the %matplotlib inline command before creating the line graph. The code runs correctly without any errors again and the plots appear inline in the notebook.
Python3
%matplotlib inline
import matplotlib.pyplot as plt
Month = ['January', 'February','March']
Share_buy = [10, 17, 30]
plt.title("Share's Buy in a month")
plt.plot(Month, Share_buy)
|
Output:
Conclusion
In conclusion, how to use of %matplotlib inline is crucial for seamlessly integrating Matplotlib visualizations . This command, placed at the code beginning, enables direct plot display below code cells, enhancing readability and supporting efficient prototyping. It minimizes distractions, fostering a cohesive data exploration experience with dynamic interaction. Proficiency in using Matplotlib plot inline is a valuable skill for creating and sharing visualizations within the environment.
Share your thoughts in the comments
Please Login to comment...