How To Install and Set Up an AWS CloudWatch Agent Using CLI?
Last Updated :
16 Jul, 2023
We will see how to install and configure the new unified CloudWatch agent on a running EC2 Linux instance. Collect logs from the Apache HTTP log file and collect metrics from our EC2 instance. New unified CloudWatch can collect both logs and metrics from EC2 instances. The older CloudWatch Logs agent is on the path to deprecation.
Features of AWS EC2
- Collect internal system-level metrics from Amazon EC2 instances across operating systems. The metrics can include in-guest metrics, in addition to the metrics for EC2 instances. The additional metrics that can be collected are listed in the Metrics collected by the CloudWatch agent.
- Collect system-level metrics from on-premises servers. These can include servers in a hybrid environment as well as servers not managed by AWS.
- Retrieve custom metrics from your applications or services using the StatsD and collectd protocols. StatsD is supported on both Linux servers and servers running Windows Server. collectd is supported only on Linux servers.
- Collect logs from Amazon EC2 instances or on-premises servers, running either Linux or Windows Server.
- Collect Custom logs from your applications.
Note: The CloudWatch agent does not support collecting logs from FIFO pipes.
CloudWatch Use Cases
- Control applications logs. We can track logs from various applications in the CloudWatch console.
- Monitor AWS instances resources and optimize them. Using CloudWatch, we can get information about the health and performance of running AWS resources. And based on this, we can draw a conclusion about the use of resources (increase or decrease the use of resources).
- Troubleshoot the AWS infrastructure. We can track and send alerts to the SNS topic based on logs or metrics. And also, if necessary, configure Autoscaling based on the metrics of our instance.
Benefits of CloudWatch
CloudWatch offers several benefits:
- Collects metrics and logs for AWS environments. We can collect and track metrics in real-time, as well as see the load graph for a long time. Also, we can monitor our logs from our applications.
- Visibility from all monitoring data on one platform. We can monitor logs and metrics from different instances and services in one CloudWatch console.
- Increases and optimizes the operational performance of AWS. By tracking logs and metrics in real-time, we can add capacity or remove unnecessary capacity. By doing this, we can optimize costs and control the stability of applications and instances.
- Easy integration with other AWS resources. If necessary, CloudWatch integrates with different AWS services, for example, AWS SNS, AWS Lambda, AWS Auto Scaling, AWS CloudFormation, etc.
Configure The CloudWatch Agent On a Running EC2 Linux Instance
1. Start An EC2 Instance
Step 1: Log in to your AWS account and start the Amazon Linux EC2 instance that you have already created.
.png)
2. Attaching an IAM Role
Step 1: Create IAM Role with permission for reading information from the instance and writing it to CloudWatch.
For that, we need to execute the following steps:
- Go to the navigation panel, choose Roles, and then choose Create Role.
- Under Select type of trusted entity, choose AWS service.
- Under Use case, choose EC2 and then choose Next.
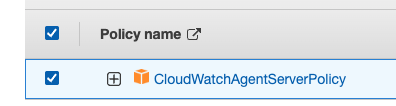
- In the list of policies, select the check box next to CloudWatchAgentServerPolicy and then choose Next.
Role Name
Step 1: For Role name, enter a name for your new role, such as “CloudWatchRole” or another name that you prefer.Confirm that CloudWatchAgentAdminPolicy appears next to Policies.Choose to Create role.
Step 2: Attach IAM Role from the previous step to our Amazon Linux EC2 instance. For that, we need to go to the navigation panel, choose EC2 and then choose Instances. Then select our instance and choose to Modify IAM role.
.png)
On the next page, we need to choose our role and then choose the Update IAM role.
3. Installing The CloudWatch Agent
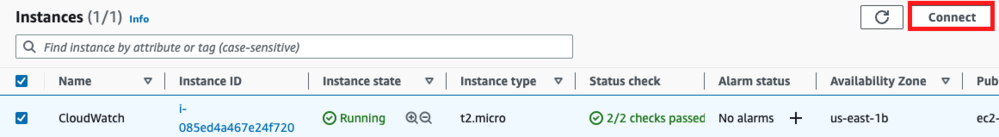
Step 1: Install the CloudWatch agent. First of all, we need to log in to our EC2 instance. (Select instance –> push Connect button). On the next page choose EC2 Instance Connect and click Connect button. A command prompt will pop up after connecting.
Note: If any error occurs, then make sure that port SSH is open on your instance.
For installation CloudWatch agent we need to execute the following command:
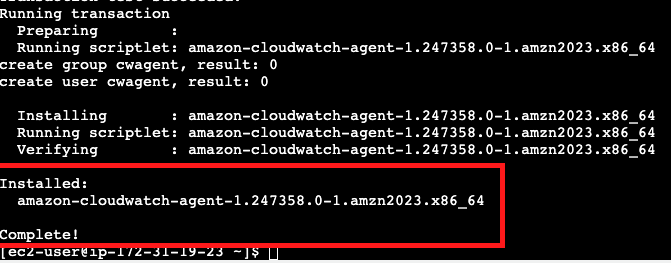
sudo yum install amazon-cloudwatch-agent -y
After running this command you will see that installation is complete.
Step 2: Configure the CloudWatch agent with the wizard and fill in data about our log file.To create a configuration file execute the following command:
sudo /opt/aws/amazon-cloudwatch-agent
/bin/amazon-cloudwatch-agent-config-wizard
After running this command we need to answer the following questions (I will provide answers for my configuration):
- On which OS are you planning to use the agent? (Linux)
- Are you using EC2 or On-Premises hosts? (EC2)
- Which user are you planning to run the agent? (root)
- Do you want to turn on the StatsD daemon? (yes)
StatsD is a popular open-source solution that can gather metrics from a wide variety of applications.
- Which port do you want the StatsD daemon to listen to? (8125)
- What is the collection interval for the StatsD daemon? (10s)
- What is the aggregation interval for metrics collected by StatsD daemon?(the 60s)
- Do you want to monitor metrics from CollectD?(No)
- Do you want to monitor any host metrics? e.g. CPU, memory, etc. (yes)
- Do you want to monitor CPU metrics per core? (yes)
- Do you want to add ec2 dimensions (ImageId, InstanceId, InstanceType, AutoScalingGroupName) into all of your metrics if the info is available? (yes)
- Do you want to aggregate ec2 dimensions (InstanceId)? (yes)
- Would you like to collect your metrics at high resolution (sub-minute resolution)? This enables sub-minute resolution for all metrics, but you can customize for specific metrics in the output JSON file. (60s)
- Which default metrics config do you want? (Standard)
On this question, you can choose the answer between Basic, Standard, Advanced, and None. (Detailed description below)
| Basic |
Mem: mem_used_percent
Disk: disk_used_percent
The disk metrics such as disk_used_percent have a dimension for Partition, which means that the number of custom metrics generated is dependent on the number of partitions associated with your instance. The number of disk partitions you have depends on which AMI you are using and the number of Amazon EBS volumes you attach to the server.
|
| Standard |
CPU: cpu_usage_idle, cpu_usage_iowait, cpu_usage_user, cpu_usage_system
Disk: disk_used_percent, disk_inodes_free
Diskio: diskio_io_time
Mem: mem_used_percent
Swap: swap_used_percent
|
| Advanced |
CPU: cpu_usage_idle, cpu_usage_iowait, cpu_usage_user, cpu_usage_system
Disk: disk_used_percent, disk_inodes_free
Diskio: diskio_io_time, diskio_write_bytes, diskio_read_bytes, diskio_writes, diskio_reads
Mem: mem_used_percent
Netstat: netstat_tcp_established, netstat_tcp_time_wait
Swap: swap_used_percent
|
After that, you will see the current configuration (JSON format) and you will need to answer the questions:
- Are you satisfied with the above config? (yes)
- Do you have any existing CloudWatch Log Agent? (no)
- Do you want to monitor any log files? (yes)
Because in this tutorial we will monitor our Apache log file(e.g. error_log)
- Log file path: (/var/log/httpd/error_log)
- default choice: (e.g. CloudWatchDemo)
- Log stream name: ({instance_id})
- Log Group Retention in days (2)
- Do you want to specify any additional log files to monitor? (no)
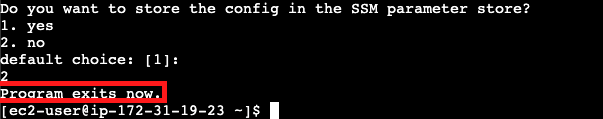
- Do you want to store the config in the SSM parameter store? (no)
After answering these questions, we see that program exits:
The configuration file will store in the “bin” folder:
ls /opt/aws/amazon-cloudwatch-agent/bin/

Step 3: Start the CloudWatch agent with our configuration file.To launch the CloudWatch agent we need to execute the following command:
sudo /opt/aws/amazon-cloudwatch-agent/bin/
amazon-cloudwatch-agent-ctl -a fetch-config -m ec2 -c
file:/opt/aws/amazon-cloudwatch-agent/bin/config.json -s
In this command, -a fetch-config causes the agent to load the latest version of the CloudWatch agent configuration file, and
-s starts the agent.
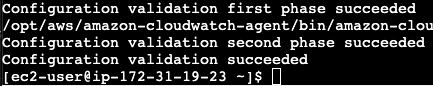
After running this command we see that execution is successfully finished.
Steps To Verify The Cloud Watch For Apache Log File
For that, we need to execute the following steps:
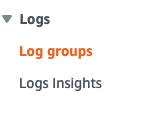
Step 1: Go to the navigation panel, and choose CloudWatch.Go to the Log groups. In this folder, we can see the log file from the EC2 Linux instance.
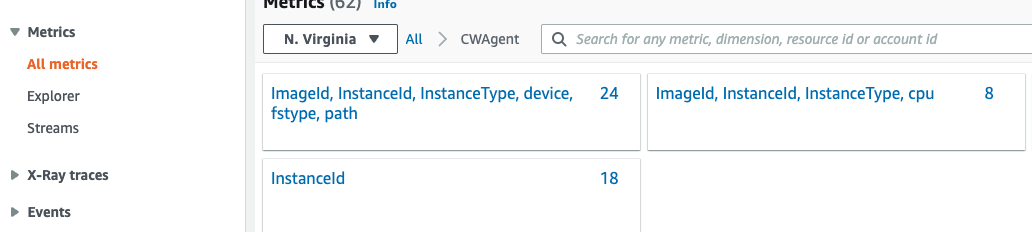
Addition: In the metric group, we can see all metrics about our EC2 instance(e.g. CPU usage, disk_used_percent, mem_used_percent, swap_used_percent, etc.).
Share your thoughts in the comments
Please Login to comment...