How to Draw 3D Cube using Matplotlib in Python?
Last Updated :
25 Jul, 2022
In this article, we will deal with the 3d plots of cubes using matplotlib and Numpy. Cubes are one of the most basic of 3D shapes. A cube is a 3-dimensional solid object bounded by 6 identical square faces. The cube has 6-faces, 12-edges, and 8-corners. All faces are squares of the same size. The total surface area of a cube is the sum of the area of the 6 identical squares.
Matplotlib comes with a wide variety of plots. Graphs help to understand trends, patterns to make correlations. Matplotlib was introduced for two-dimensional plotting. The 3d plot is enabled by importing the mplot3d toolkit., which comes with your standard Matplotlib. After importing, 3D plots can be created by passing the keyword projection=”3d” to any of the regular axes creation functions in Matplotlib.
Modules Needed
- Matplotlib: It is a plotting library for Python programming it serves as a visualization utility library, Matplotlib is built on NumPy arrays, and designed to work with the broader SciPy stack.
- Numpy: It is a general-purpose array-processing package. It provides a high-performance multidimensional array and matrices along with a large collection of high-level mathematical functions.
- mpl_toolkits: It provides some basic 3d plotting (scatter, surf, line, mesh) tools. It is a collection of helper classes for displaying 3d axes in Matplotlib.
Approach
Step 1: Import libraries.
import matplotlib.pyplot as plt
from mpl_toolkits.mplot3d import Axes3D
import numpy as np
Step 2: In this step, we are selecting the 3D axis of the dimension X =5, Y=5, Z=5, and in np.ones() we are passing the dimensions of the cube.
# Create axis
axes = [5, 5, 5]

# Create Data
data = np.ones(axes)
Step 3: In this step, we are selecting color opacity as alpha = 0.9 ( vary from 0.0 – 1.0 ). In the next step, we are passing the dimension of axes( i.e 5, 5, 5) + number of faces for the cube ( i.e 0-4 ) in np.empty() function after that we are passing color combination and opacity for each face of the cube.
# control Transparency
alpha = 0.9

# control colour
colors = np.empty(axes + [4])

colors[0] = [1, 0, 0, alpha] # red
colors[1] = [0, 1, 0, alpha] # green
colors[2] = [0, 0, 1, alpha] # blue
colors[3] = [1, 1, 0, alpha] # yellow
colors[4] = [1, 1, 1, alpha] # grey
Step 4: In this step, we used figure() function of the matplotlib library which is used to create a new figure, After that, we used add_subplot() method to add an Axes to the figure as 3-Dimensional(i.e Projection = ‘3d’) part of a subplot arrangement. It has 3 arguments.
- The number of rows in the grid,
- The number of columns in the grid and,
- The position at which the new subplot must be placed.
It is to be noted that fig.add_subplot(1, 1, 1) is equivalent to fig.add_subplot(111).
# Plot figure
fig = plt.figure()
ax = fig.add_subplot(111, projection='3d')
Step 5: And in this last step Voxels is used for customizations of the size, position, and grid color. The proper syntax is provided above.
# Voxels is used to customizations of the
# sizes, positions and colors.
ax.voxels(data, facecolors=colors, edgecolors='grey')
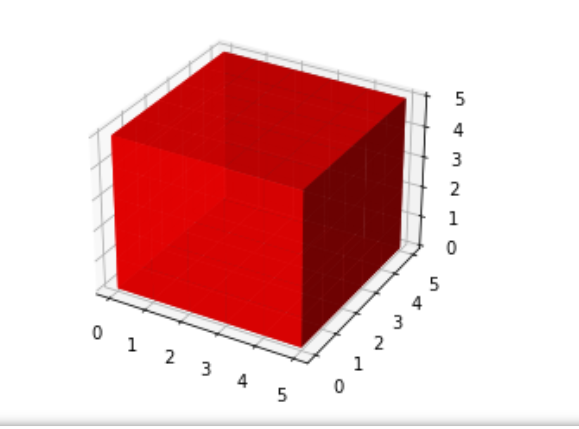
Example 1: Simple cube of one color.
Here changing colors[ : ], means we are selecting all the array elements as one color (i.e red) and to remove the grid we deleted ‘edgecolor’ parameter from voxels method to have simply one color cube.
Python3
import matplotlib.pyplot as plt
from mpl_toolkits.mplot3d import Axes3D
import numpy as np
axes = [5, 5, 5]
data = np.ones(axes, dtype=np.bool)
alpha = 0.9
colors = np.empty(axes + [4], dtype=np.float32)
colors[:] = [1, 0, 0, alpha]
fig = plt.figure()
ax = fig.add_subplot(111, projection='3d')
ax.voxels(data, facecolors=colors)
|
Output:
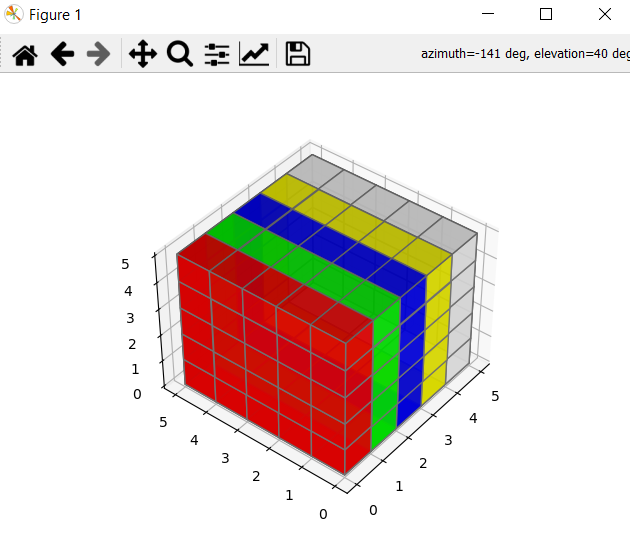
Example 2:
Cube with Grid and different color
Python3
import matplotlib.pyplot as plt
from mpl_toolkits.mplot3d import Axes3D
import numpy as np
axes = [5, 5, 5]
data = np.ones(axes, dtype=np.bool)
alpha = 0.9
colors = np.empty(axes + [4], dtype=np.float32)
colors[0] = [1, 0, 0, alpha]
colors[1] = [0, 1, 0, alpha]
colors[2] = [0, 0, 1, alpha]
colors[3] = [1, 1, 0, alpha]
colors[4] = [1, 1, 1, alpha]
fig = plt.figure()
ax = fig.add_subplot(111, projection='3d')
ax.voxels(data, facecolors=colors, edgecolors='grey')
|
Output:
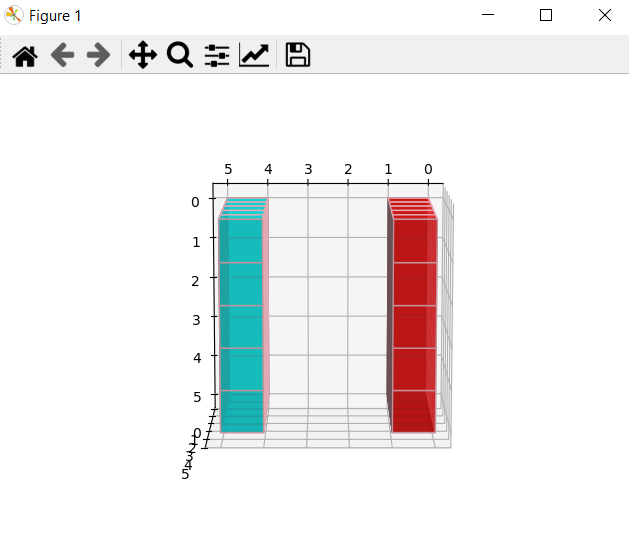
Example 3: Faced cube along Y – axes
In this example, we will add one more line of code view_init( ) to change the axis view as we want. The view_init() can be used to change the axes view programmatically. Here we are using elev=100 and azim=0.
Syntax: view_init(elev, azim)
Parameters:
- ‘elev’ stores the elevation angle in the z plane.
- ‘azim’ stores the azimuth angle in the x,y plane.
Python3
import matplotlib.pyplot as plt
from mpl_toolkits.mplot3d import Axes3D
import numpy as np
axes = [5, 5, 5]
data = np.ones(axes, dtype=np.bool)
colors = np.empty(axes + [4], dtype=np.float32)
alpha = .7
colors[0] = [1, 0, 0, alpha]
colors[1] = [0, 1, 0, alpha]
colors[2] = [0, 0, 1, alpha]
colors[3] = [1, 1, 0, alpha]
colors[4] = [0, 1, 1, alpha]
colors[1:-1, 1:-1, 1:-1, 0:3] = 0
colors[1:-1, 1:-1, 1:-1, 3] = 1
fig = plt.figure()
ax = fig.add_subplot(111, projection='3d')
data[-1] = True
data[-2] = False
data[-3] = False
data[-4] = False
data[-5] = True
ax.voxels(data, facecolors=colors, edgecolors='pink')
ax.view_init(100, 0)
|
Output:
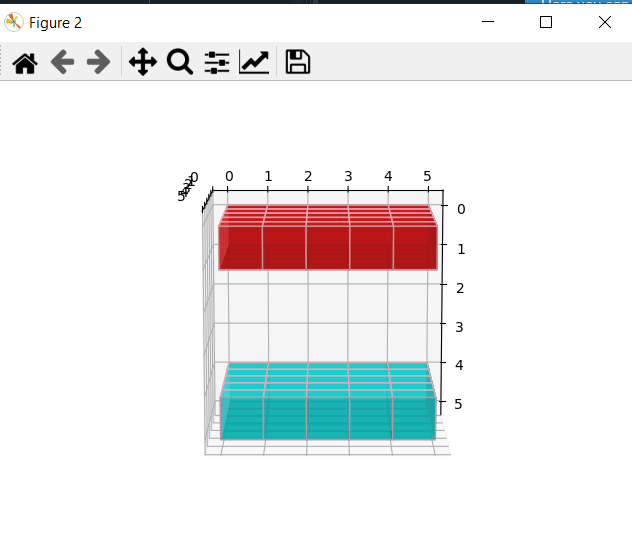
Example 4: Faced cube along X-axes
The view_init() can be used to change the axes view programmatically. Here we are using elev=100 and azim=90.
Python3
import matplotlib.pyplot as plt
from mpl_toolkits.mplot3d import Axes3D
import numpy as np
axes = [5, 5, 5]
data = np.ones(axes, dtype=np.bool)
colors = np.empty(axes + [4], dtype=np.float32)
alpha = .7
colors[0] = [1, 0, 0, alpha]
colors[1] = [0, 1, 0, alpha]
colors[2] = [0, 0, 1, alpha]
colors[3] = [1, 1, 0, alpha]
colors[4] = [0, 1, 1, alpha]
colors[1:-1, 1:-1, 1:-1, 0:3] = 0
colors[1:-1, 1:-1, 1:-1, 3] = 1
fig = plt.figure()
ax = fig.add_subplot(111, projection='3d')
data[-1] = 1
data[-2] = False
data[-3] = False
data[-4] = False
data[-5] = True
ax.voxels(data, facecolors=colors, edgecolors='pink')
ax.view_init(100, 90)
|
Output:
Share your thoughts in the comments
Please Login to comment...