How to Debug Error in plot.new() – R Plotting Issues
Last Updated :
12 Apr, 2024
Plotting in R is an effective tool for visualizing data, but errors are not uncommon, especially when dealing with complex plots or huge datasets. This issue usually arises when you try to add additional plots to an existing plot region or create a new plot without clearing the previous one. In this article, we’ll explore some common errors when using this plot.new function and resolve errors related to this in R Programming Language.
Common causes of the error
The plot. new() error usually appears when there is an issue with establishing a new plot in the R environment. Common causes of this error include syntax errors, incorrect data inputs, or issues with plot dimensions.
1. Syntax Error in Plotting Command
This error occurs due to a syntax error in the plotting command. In this example, the closing quotation mark for the main title is missing.
R
#Error Example
x <- 1:5
y <- 1:5
plot(x, y, type = "l", main = "Line Plot)
Output :
Error: unexpected end of input
To avoid this error ensure that the syntax of the plotting command is correct, including proper quotation marks and parentheses.
R
# Solution Example
x <- 1:5
y <- 1:5
plot(x, y, type = "l", main = "Line Plot")
Output :
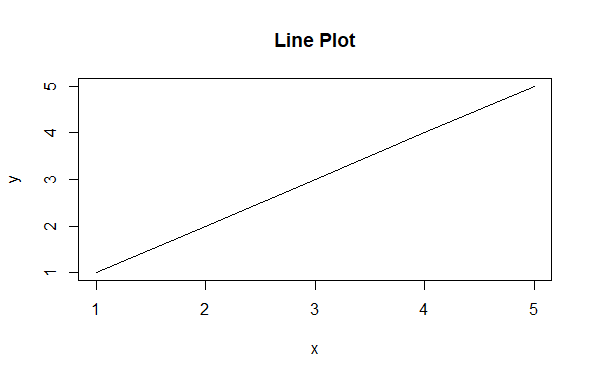
Debug Error in plot.new()
2. Data Input Error
R
# Error Example
x <- 1:5
y <- 1:6
plot(x, y)
Output :
Error in xy.coords(x, y, xlabel, ylabel, log) : 'x' and 'y' lengths differ
This error occurs when the length of the vectors is unequal , in a error example x and y lengths is different.
To solve this error Ensure to correct the both x and y vectors have a same length.
R
# Solution Example
x <- 1:5
y <- 1:5
plot(x, y)
Output :

Debug Error in plot.new()
3. Package Dependency Error
R
# Error Example
library(ggplot)
plot(x = 1:10, y = 1:10)
Output :
Error in library(ggplot) : there is no package called 'ggplot'
This error occurs when you give incorrect name package.
To solve this error ensure to Correct the package name to ggplot2 for ggplot functionalities
R
# Solution Example
library(ggplot2)
plot(x = 1:10, y = 1:10)
Output:

Debug Error in plot.new()
4. Memory Management Error
R
# Error Example
x <- matrix(1, nrow = 1e6, ncol = 1e6)
plot(x)
Output :
Error: cannot allocate vector of size 7450.6 Gb
This error occur because of The dataset x is too large, this causes memory management issues during plotting.
To solve this error Reduce the size of the dataset or use memory-efficient plotting functions to handle large datasets.
R
# Solution Example
x <- matrix(1, nrow = 1000, ncol = 1000)
plot(x)
Output:

Debug Error in plot.new()
Conclusion
Debugging plot.new() issues in R necessitates careful attention to syntax, data inputs, and plot dimensions. By thoroughly resolving these issues and successfully using error messages.By thoroughly resolving these issues and successfully using error messages.you can overcome plot.new() errors and create successful plots with confidence. Patience and persistence are key to mastering the art of debugging in R.
Share your thoughts in the comments
Please Login to comment...