How to Create Calculated Columns in Power Pivot in Excel
Last Updated :
09 Oct, 2023
Power Pivot is an advanced data modeling tool that aims to perform advanced calculations on large datasets. Calculated columns are one of its features that makes it highly popular and help users derive new data by applying custom formulas to existing data columns. So, in this article, we will understand what are calculated columns, how to create them and what are their advantages as well as limitations.
What are Calculated Columns in Excel
Calculated columns are basically the dynamic columns that help one with data modeling. These columns are meant to contain values calculated from formulas or expressions defined by the user. Unlike how calculated fields work in Power Pivot, calculated columns compute their values during data refresh. This ability of theirs makes them suitable for scenarios where one needs to pre-compute data for sorting, filtering, complex calculations, or creating hierarchies. Now, let’s look at the steps for how to create these columns:-
Create Calculated Columns in Power Pivot in Excel
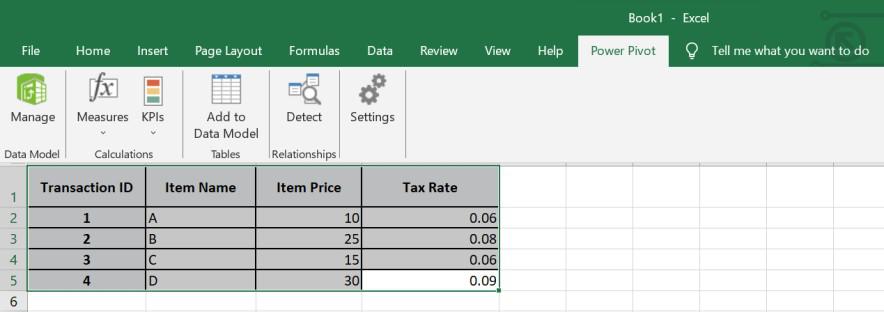
Step 1: Open the Power Pivot Window
.jpg) Step 2: Select the table to which you want to add the calculated column
Step 2: Select the table to which you want to add the calculated column
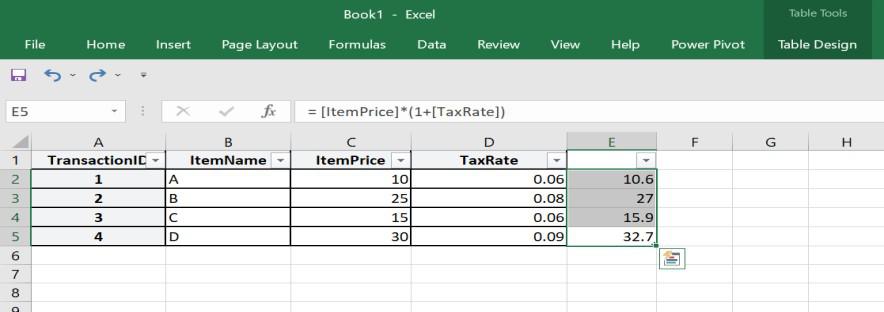
Step 3: Select the empty column and enter the formula for your calculated column in the formula bar and press Enter
=[ItemPrice]*(1+TaxRate])

How to Create Calculated Columns in Power Pivot in Excel Examples
Example 1
| Transaction ID |
Item Name |
Item Price |
Tax Rate |
| 1 |
A |
10.00 |
0.06 |
| 2 |
B |
25.00 |
0.08 |
| 3 |
C |
15.00 |
0.06 |
| 4 |
D |
30.00 |
0.09 |
Let us consider a retail dataset that contains sales transactions with columns for “Item Price” and “Tax Rate.” So, when we need to calculate the total price (including tax), we can create a calculated column like:
Total Price with Tax = [Item Price] * (1 + [Tax Rate])
This way, calculated column will compute the total price for each and every transaction as shown in the example above. Now, it becomes easy to analyse and visualize data based on this new column and perform tasks such as creating a chart of tax revenue or calculating the average total price with tax .
Example 2
| Name |
Birthdate |
| John |
1985-03-15 |
| Agasthi |
1990-12-02 |
| Emily |
2000-04-10 |
| Sarah |
1978-08-22 |
This dataset contains birthdates, and we aim to calculate the age of individuals. A calculated column can help one simplify this process as :
Age = YEAR(TODAY()) – YEAR([Birthdate])
.jpg)
The “Age” calculated column hereby, computes the age of each individual based on their birthdate and the current year. This allows us to analyse the data by age groups, calculate statistics related to age or filter by specific age ranges.
Advantages of Calculated Columns in Power Pivot
- Enhanced Performance: As mentioned above, calculated columns are computed during data refresh and hence it reduces the need for real time calculations. This highly enhances the performance of complex dashboards and reports.
- Simplified Formulas: Calculated Columns also helps one simplify formulas as one encapsulates complex calculations into re-usable, easily comprehendible columns which enhances the clarity of the data model.
- Ease in filtering and sorting: It also helps in creating custom hierarchies, filter records based on derived values and sort data in specific ways.
- Data Consistency: Calculated Columns also helps one in ensuring that derived data is remaining consistent throughout the analysis. So, it helps user by avoiding the need to recompute values manually or worry about discrepancies.
Limitations of Calculated Columns in Power Pivot
- Huge Consumption Of Memory: Calculated Columns consume a huge chunk of memory as they store additional data. These large datasets with numerous calculated columns can impact performance and increase file size.
- Non-Addictive Measures: It is not suitable for measures that require sums, aggregations or averages. For such cases, calculated fields are more helpful.
Conclusion
Hence, Calculated columns in Power Pivot are a vital tool for data modeling and analysis in Microsoft Excel. They empower users to perform create meaningful insights, complex calculations, and enhance the performance of their reports . By understanding their capabilities, one can leverage calculated columns to unlock the full potential of your data and make more informed decisions in various business contexts.
FAQs
What is the Difference between measures and calculated columns in Power Pivot?
Measures are typically employed in the VALUES section of a PivotTable or PivotChart. Calculated columns, on the other hand, are utilized when you intend to display calculated outcomes in a distinct part of a PivotTable, like a column or row, or on an axis in a PivotChart.
How to generate a calculated columns in Power Pivot?
- Locate and select the right-most column in the desired table.
- In the formula bar, input a valid DAX formula and hit Enter.
- Right-click on the column header, choose “Rename,” and provide a name for the column.
When should I utilise calculated columns ?
In a Power Pivot data model, a calculated column is a column that you build by specifying a formula or expression. When you need to create new data based on existing columns and you prefer for those values to be computed during data refresh rather than on-the-fly during analysis, you should utilise calculated columns.
Are calculated columns the same as calculated fields (measures) in Power Pivot?
No, calculated columns and calculated fields are completely different concepts. Calculated columns add new columns with precomputed values to your data model, whereas calculated fields are used for aggregations and are computed on-the-fly based on filter context.
Can I change or alter a calculated column after it has been created?
Yes, Power Pivot allows you to alter or change a computed column. To edit a calculated column, just double-click on it after opening the Power Pivot window and selecting the table that the calculated column is contained in. The formula can then be changed in the formula bar.
Does the performance of my Power Pivot model suffer from calculated columns?
Yes, computed columns use memory and may increase your Power Pivot workbook’s file size. Large datasets with a lot of computed columns could operate slower and require more time for a data refresh. The addition of calculated columns must be balanced with preserving high performance.
Share your thoughts in the comments
Please Login to comment...