How to convert table to dataframe in R?
Last Updated :
08 Oct, 2021
In this article, we will discuss how to convert a given table to a dataframe in the R programming language.
Functions Used
- as.data.frame.matrix() will be taking the table as its parameter and will return the dataframe back to the user.
Syntax: as.data.frame.matrix(x)
Parameter:
- x: name of the table which is to be converted into dataframe
Returns: It will return the dataframe which is converted from the given data.
- table() function is used for the cross-classifying factors to build a contingency table of the counts at each combination of factor levels of the provided data in R language.
Syntax: table(…,exclude = if (useNA == “no”) c(NA, NaN),useNA = c(“no”, “ifany”, “always”),dnn = list.names(…), deparse.level = 1)
Returns:
This function will be returning the frequency table of the provided data back to the user.
Thus, we will first create a contingency table using table() function from a dataframe and then convert this table to a dataframe.
Given below are some implementations for this.
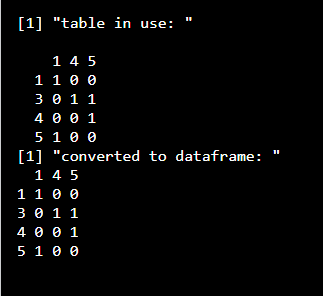
Example 1:
R
data_gfg=data.frame(x=c(1,3,5,3,4),
y=c(1,5,1,4,5))
table_gfg=table(data_gfg$x,data_gfg$y)
print("table in use: ")
table_gfg
new_data_gfg=as.data.frame.matrix(table_gfg)
print("converted to dataframe: ")
new_data_gfg
|
Output:
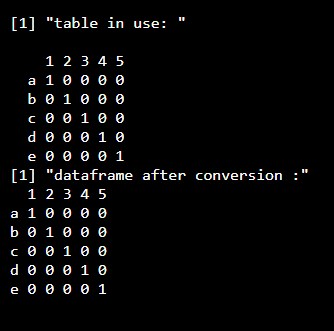
Example 2:
R
data_gfg=data.frame(x=c("a","b","c","d","e"),
y=c("1","2","3","4","5"))
table_gfg=table(data_gfg$x,data_gfg$y)
print("table in use: ")
table_gfg
new_data_gfg=as.data.frame.matrix(table_gfg)
print("dataframe after conversion :")
new_data_gfg
|
Output:
Share your thoughts in the comments
Please Login to comment...