How to Calculate F1 Score in R?
Last Updated :
03 Jan, 2023
In this article, we will be looking at the approach to calculate F1 Score using the various packages and their various functionalities in the R language.
F1 Score
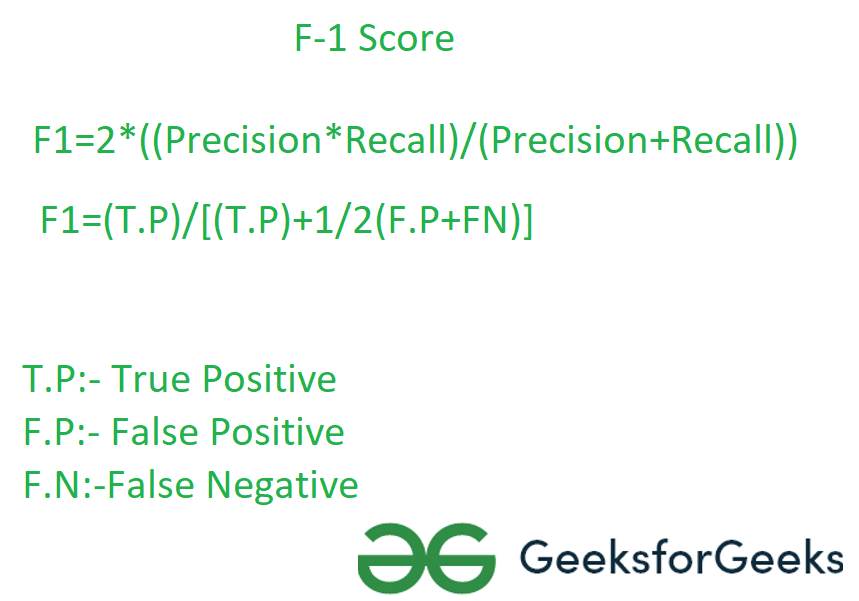
The F-score or F-measure is a measure of a test’s accuracy. It is calculated from the precision and recall of the test, where the precision is the number of true positive results divided by the number of all positive results, including those not identified correctly, and the recall is the number of true positive results divided by the number of all samples that should have been identified as positive.
Method 1: Using F1_Score function from Mlmetrics package
Under this approach to calculate the f1 score, the user needs to install and import the Mlmetrics package in the current working R console and further, the user needs to call the F1_Score() function from this package and pass it with the required parameter to get the F1 score of the predicted and the actual value and further in return this function will be returning the F1 score of the given actual and the predicted values.
Syntax to install and import the Mlmetrics package in R language:
install.packages("MLmetrics")
library("MLmetrics")
F1_Score() function: This function is used to calculate the F1 score.
Syntax: F1_Score(y_true, y_pred, positive = NULL)
Parameters:
- y_true: Ground truth (correct) 0-1 labels vector
- y_pred: Predicted labels vector, as returned by a classifier
- positive: An optional character string for the factor level that corresponds to a “positive” result
Example: In this example, we are creating two vectors of 10 data points one with the actual values and another with the predicted values and with the help of the F1_Score() function from the MLmetrics package we are calculating the f1 score in the R programming.
R
library(MLmetrics)
actual = c(1,2,28,1,5,6,7,8,9,10)
predicted = c(1,2,3,4,5,6,7,8,9,10)
F1_Score(predicted,actual)
|
Output:
[1] 0.6666667
Method 2: Using confusionMatrix() function from caret package
In this approach to calculate the F1 score, the user needs to first install and import the caret package in the working R console, and then further the user needs to call the confusionMatrix() function and pass the required parameter into it. This will be returning the F1 score back to the user of the given data in the R language.
Syntax to install and import the caret package in R language:
install.packages("caret")
library("caret")
confusionMatrix() function: Calculates a cross-tabulation of observed and predicted classes with associated statistics.
Syntax: confusionMatrix(data, reference, positive = NULL, dnn = c(“Prediction”, “Reference”), …)
Parameters:
- data: a factor of predicted classes
- reference: a factor of classes to be used as the true results
- positive: an optional character string for the factor level that corresponds to a “positive” result (if that makes sense for your data).
- dnn: a character vector of dimnames for the table
- …: options to be passed.
Example: In this example, we are two vectors, one with the actual data and another with the predicted data, and further, we are using the confusionMatrix() function to get the F1 score of the given data.
R
library(caret)
actual <- factor(rep(c(1, 2),
times=c(16, 24)))
predicted <- factor(rep(c(1, 2, 1, 2),
times=c(12, 4, 7, 17)))
confusionMatrix(predicted, actual,
mode = "everything",
positive="1")
|
Output:
Confusion Matrix and Statistics

          Reference
Prediction  1  2
         1 12  7
         2  4 17

               Accuracy : 0.725
                 95% CI : (0.5611, 0.854)
    No Information Rate : 0.6
    P-Value [Acc > NIR] : 0.07095

                  Kappa : 0.4444

 Mcnemar's Test P-Value : 0.54649

            Sensitivity : 0.7500
            Specificity : 0.7083
         Pos Pred Value : 0.6316
         Neg Pred Value : 0.8095
              Precision : 0.6316
                 Recall : 0.7500
                     F1 : 0.6857
             Prevalence : 0.4000
         Detection Rate : 0.3000
   Detection Prevalence : 0.4750
      Balanced Accuracy : 0.7292

       'Positive' Class : 1
Method 3: Calculate F1 score of the model:
In this method to calculate the F1 score of the model, the user needs to first create the model regarding the given data then the user needs to calculate the confusion matrix of that model, further the err_metric() function with the confusion matrix pass as its parameter to the f1 score of the built model in the R programming language.
Syntax: err_metric(cm)
Where, cm: confusion matrix
Example: In this example, we will be simply creating a model of logistic regression of the given data set and then using the err_metrics() function to calculate the f1 score in the R programming language.
The link of the dataset.
R
library(caTools)
data = read.csv('Social_Network_Ads.csv')
data = data[3:5]
split = sample.split(data$Purchased, SplitRatio = 0.75)
train = subset (data, split == TRUE)
test = subset (data, split == FALSE)
train[-3] = scale(train[-3])
test[-3] = scale(test[-3])
classifier = glm(formula = Purchased ~ .,
family = binomial,
data = train)
prob_pred = predict (classifier, type = 'response',
newdata = test[-3])
y_pred = ifelse (prob_pred > 0.5, 1, 0)
cm = table (test[, 3], y_pred > 0.5)
err_metric(cm)
|
Output:
[1] "Precision value of the model:  0.72"
[1] "Accuracy of the model:  0.77"
[1] "Recall value of the model:  0.12"
[1] "False Positive rate of the model:  0.12"
[1] "False Negative rate of the model:  0.42"
[1] "f1 score of the model:  0.21"
Share your thoughts in the comments
Please Login to comment...