How to Add Highcharts using Angular 9/8 ?
Last Updated :
07 Sep, 2022
Highcharts is a JavaScript-based library that allows us to create highly interactive charts that show information at a glance. It was released in the year 2009 by Torstein Hønsi at Highsoft, Norway. This library is a powerful charting aid that helps visualize data and convey meaningful information to the end user by showing different types of charts like lines, areas, pies, donuts, etc. They are compatible across all JavaScript frameworks like Angular, React, Vue.js, etc.
The library is free for all non-commercial uses and runs natively on any browser platform without requiring the need to install any plugin like Flash or Silverlight. One more advantage of using this library is that the charts are rendered using SVG (scalable vector graphics). This means, that whenever, we resize our chart, or view it on a different device having a vivid screen size range, we can easily view the image and its quality will remain consistent for all screen types.
We can use the tag <highcharts-chart> to create such interactive charts. We can also specify other chart options for it using the [options] field like the chart type, axes titles, tooltips, chart labels, and much more.
Syntax:
<highcharts-chart
  [options] = "options"
</highcharts-chart>
Installation Syntax: To use the basic highchart library, we must have Angular CLI installed on the local machine, which will help to add and configure the charting library. After satisfying the required condition, type the following command on the Angular CLI:
- Run the following command to install the Highcharts library:
npm install highcharts --save
- Next, we need a highchairs wrapper module for Angular It contains some core dependencies, additional modules, plugins, etc. To add it, run the following command :
npm install highcharts-angular --save
- Import the HighchartsChartModule into our application by adding it to the imports section in the app.module.ts file.
@NgModule({
 declarations: [
   ..
   ],
 imports: [
   ..
   HighchartsChartModule
 ],
Project Structure: After successful installation, the project structure will look like the following image:
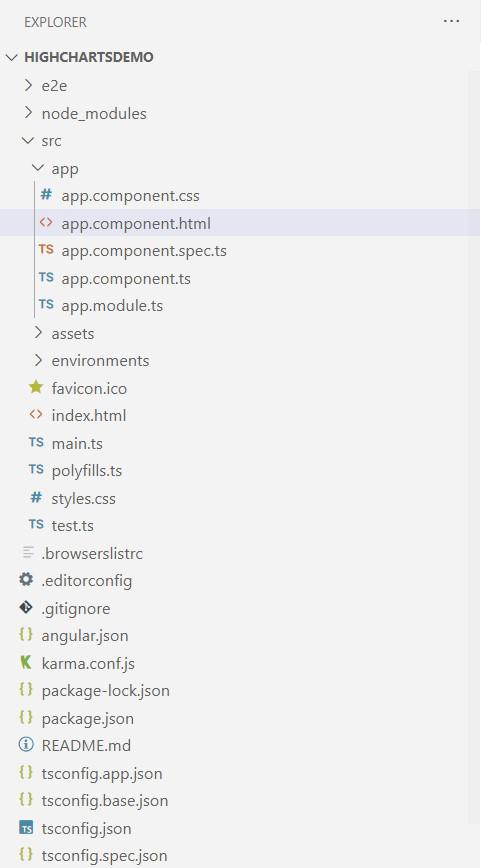
Project Structure
Example: The below example illustrates the implementation of the Angular Highcharts.
app.module.ts
import { BrowserModule } from '@angular/platform-browser';
import { NgModule } from '@angular/core';
import { AppComponent } from './app.component';
import { HighchartsChartModule }
from 'highcharts-angular';
@NgModule({
declarations: [AppComponent],
imports: [BrowserModule,
HighchartsChartModule],
bootstrap: [AppComponent],
})
export class AppModule { }
|
app.component.ts
import { Component } from "@angular/core";
import * as HighCharts from "highcharts";
@Component({
selector: "app-root",
templateUrl: "./app.component.html",
styleUrls: ["./app.component.css"],
})
export class AppComponent {
title = "HighChartsDemo";
highcharts = HighCharts;
config = {
chart: {
type: "column",
},
title: {
text: "Average Number of People born",
},
subtitle: {
text: "Average number of daily births" +
" per month in India vs USA from 2000 to 2020",
},
xAxis: {
categories: [
"Jan",
"Feb",
"Mar",
"Apr",
"May",
"Jun",
"Jul",
"Aug",
"Sep",
"Oct",
"Nov",
"Dec",
],
},
yAxis: {
title: {
text: "Average Births",
},
},
tooltip: {
valueSuffix: " K",
},
series: [
{
name: "India",
data: [70, 69, 95, 145, 188, 255,
222, 260, 233, 183, 139, 96],
},
{
name: "USA",
data: [60, 57, 85, 130, 195, 215,
172, 210, 143, 233, 179, 200],
},
],
};
}
|
app.component.html
<h1>GeeksForGeeks</h1>
<h3>Add Highcharts using Angular 9/8</h3>
<highcharts-chart [Highcharts]="highcharts"
[options]="config" style=
"width: 50%;
height: 300px;
display: flex;
margin: 0 auto;">
</highcharts-chart>
|
app.component.css
h1,
h3 {
color: green;
font-family: "Roboto", sans-serif;
text-align: center;
}
|
Output:
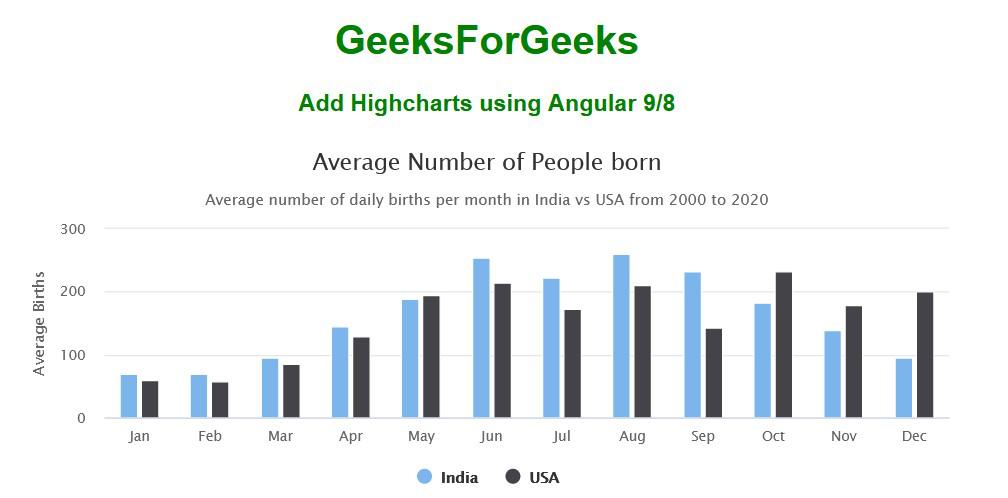
Column Highchart
Share your thoughts in the comments
Please Login to comment...