House of Quality Example in Software Quality
Last Updated :
31 Aug, 2020
Prerequisite – Quality Function Deployment (QFD)
House of Quality and its parts have been discussed in prerequisite article. Here, we will understand how to construct a house of quality from scratch.
Question :
Construct House of Quality diagram for product – CHOCOLATE.
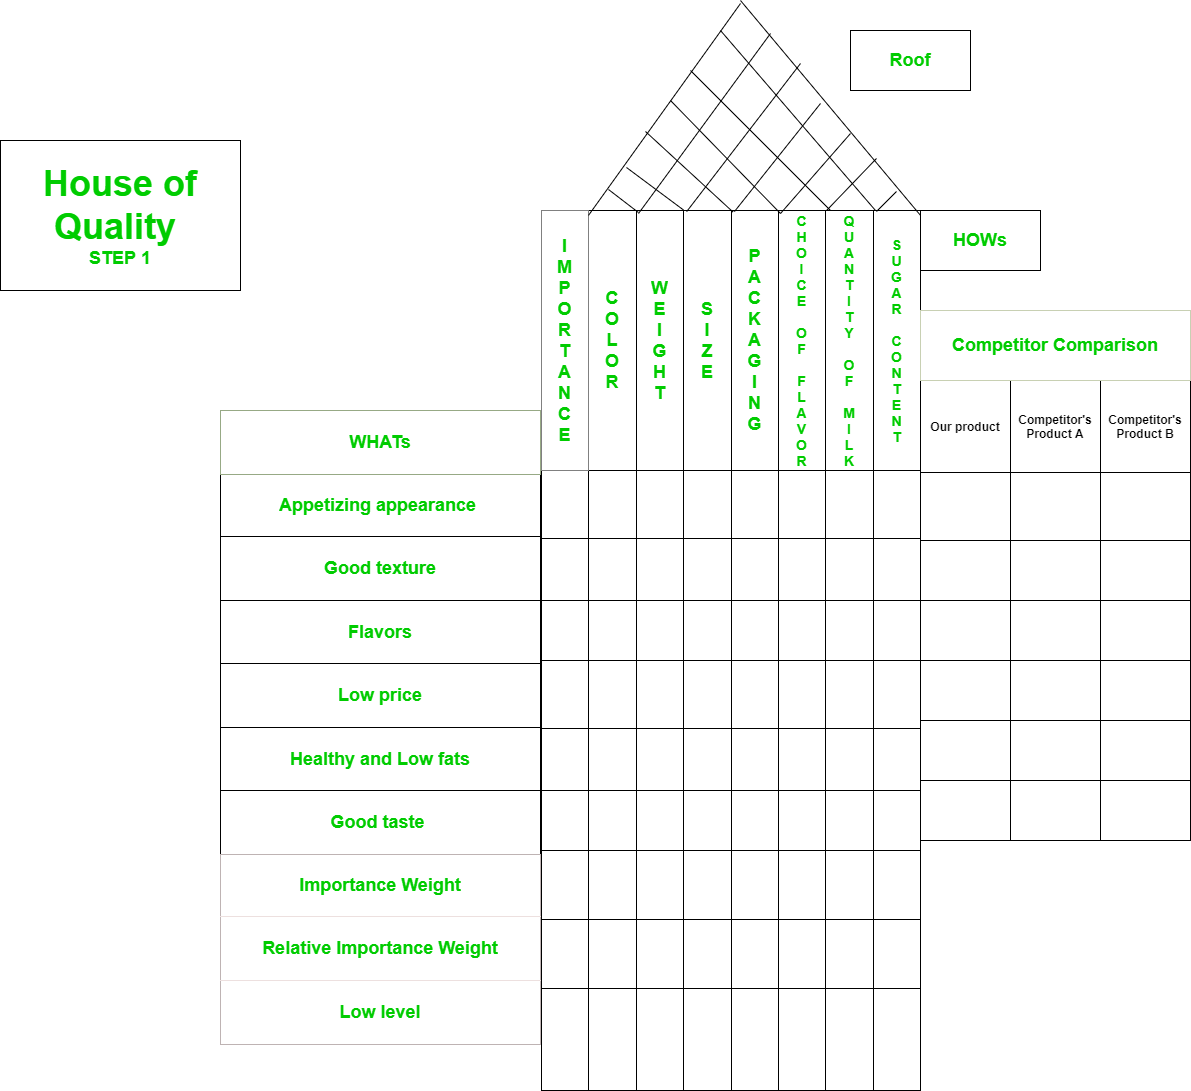
Let’s first identify Customer requirements (WHATs) and design or technical specifications (HOWs) :
- WHATs for product – chocolate could be :
- Appetizing appearance
- Good texture
- Flavors
- Low price
- Healthy and Low fats
- Good taste
- HOWs for the product – chocolate are :
- Color
- Weight
- Size/Dimension
- Packaging
- Choice of flavors
- Quantity of milk
- Sugar content
Now, let’s fill all of them in House of Quality diagram :
Now, let’s make use of body ranking system shown below and assign rank symbols in body of house of quality by identifying correlation between WHATs and HOWs.
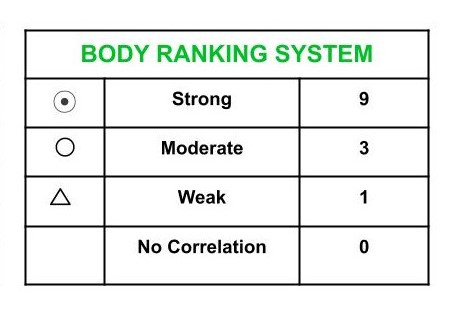
- Strong correlation exists between :
- Appetizing appearance – Color
- Good texture – Color
- Good texture – Packaging
- Flavors – Choice of flavors
- Flavors – Sugar content
- Healthy and Low fats – Quantity of Milk
- Good taste – Sugar content
- Moderate correlation exists between :
- Appetizing appearance – Weight
- Appetizing appearance – Packaging
- Appetizing appearance – Choice of flavors
- Low price – Size/Dimension
- Low price – Quantity of Milk
- Good taste – Choice of flavors
- Good taste – Quantity of Milk
- Weak correlation exists between :
- Appetizing appearance – Size/Dimension
- Appetizing appearance – Quantity of Milk
- Flavors – Quantity of Milk
- Low price – Choice of flavors
- Healthy and Low fats – Choice of flavors
- Good taste – Packaging
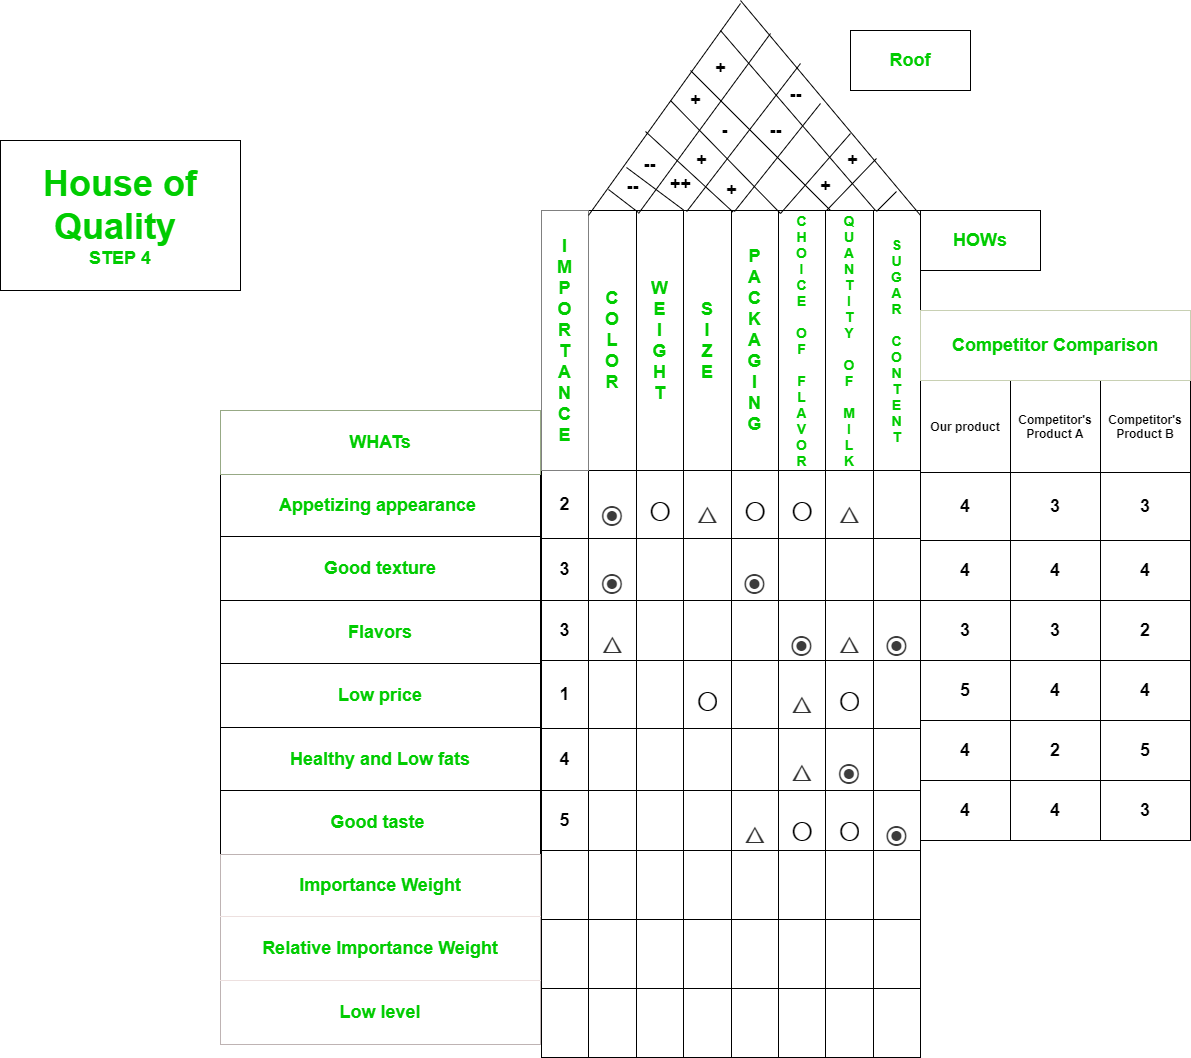
- The rest of cells in body of matrix have no correlation, so they are left empty. Importance factor is assigned by team on basis of prioritized customer requirements. In our example, let’s assign importance factor as follows :
- Appetizing appearance – 2
- Good texture – 3
- Flavors – 3
- Low price – 1
- Healthy and Low fats – 4
- Good taste – 5
After filling body, house of quality diagram will be as follows :

Now, let’s fill roof of house of quality in a similar manner by following roof ranking system given below.

- Strong positive Interaction :
- Weight – Size
- Positive Interaction :
- Color – Choice of flavor
- Color – Quantity of milk
- Weight – Packaging
- Size – Packaging
- Choice of flavor – Sugar content
- Choice of flavor – Quantity of milk
- Negative Interaction :
- Weight – Choice of flavor
- Strong negative Interaction :
- Color – Weight
- Color – Size
- Size – Quantity of milk
- Size – Sugar content
- The rest of interactions are None Updated house of quality diagram is shown below :

The next step is to fill competitor comparison part. So, this part can be filled either by product development team or by conducting surveys or taking feedback from customers.
Now, let’s calculate Importance Weight and Relative Importance Weight.
Importance Weight (Color)
= 9 * 2 + 3 * 9 + 3 * 1 = 48

Importance Weight (Weight)
= 3 * 2 = 6

Importance Weight (Size)
= 2 * 1 + 1 * 3 = 5

Importance Weight (Packaging)
= 2 * 3 + 3 * 9 + 5 * 1 = 38

Importance Weight (Choice of flavor)
= 2 * 3 + 3 * 9 + 1 * 1 + 4 * 1 + 5 * 3 = 53

Importance Weight (Quantity of milk)
= 2 * 1 + 3 * 1 + 1 * 3 + 4 * 9 + 5 * 3 = 59

Importance Weight (Sugar content)
= 3 * 9 + 5 * 9 = 72

Total Importance Weight
= 48 + 6 + 5 + 38 + 53 + 59 + 72
= 281
Now, Relative Importance Weight :
Relative Importance Weight (Color)
= ( 48 / 281 ) * 100 = 17.1

Relative Importance Weight (Weight)
= ( 6 / 281 ) * 100 = 2.14

Relative Importance Weight (Size)
= ( 5 / 281 ) * 100 = 1.78

Relative Importance Weight (Packaging)
= ( 38 / 281 ) * 100 = 13.5

Relative Importance Weight (Choice of flavor)
= ( 53 / 281 ) * 100 = 18.86

Relative Importance Weight (Quantity of milk)
= ( 59 / 281 ) * 100 = 21.0

Relative Importance Weight (Sugar content)
= ( 72 / 281 ) * 100 = 25.6
Now, we need to fill these values in house of quality. The final house of quality diagram is shown below :

Note –
The low level of house of quality is filled using more specific target values for product and other competitor’s products.
Share your thoughts in the comments
Please Login to comment...