Hierarchical Density-Based Spatial Clustering of Applications with Noise (HDBSCAN)
Last Updated :
15 Mar, 2024
Clustering is a machine-learning technique that divides data into groups, or clusters, based on similarity. By putting similar data points together and separating dissimilar points into separate clusters, it seeks to uncover underlying structures in datasets.
In this article, we will focus on the HDBSCAN (Hierarchical Density-Based Spatial Clustering of Applications with Noise) technique. Like other clustering methods, HDBSCAN begins by determining the proximity of the data points, distinguishing the regions with high density from sparse regions. But what distinguishes HDBSCAN from other methods is its capacity to dynamically adjust to the different densities and forms of clusters in the data, producing more reliable and adaptable clustering results.
What is HDBSCAN?
HDBSCAN is a clustering algorithm that is designed to uncover clusters in datasets based on the density distribution of data points. Unlike some other clustering methods, it doesn’t requires specifying the number of clusters in advance, making it more adaptable to different datasets. It uses high-density regions to identify clusters and views isolated or low-density points as noise. HDBSCAN is especially helpful for datasets with complex structures or varying densities because it creates a hierarchical tree of clusters that enable users to examine the data at different levels of granularity.
How does HDBSCAN work?
HDBSAN examines the density of the data points in the dataset. It starts by calculating a density-based clustering hierarchy, which creates clusters from densely connected data points. This hierarchical structure enables the recognition of clusters of various shapes and sizes.
The algorithm then extracts clusters from the hierarchy, taking into the account the stability of cluster assignments across different levels of the hierarchy. It identifies stable clusters as those with consistent memberships at multiple levels, ensuring cluster formation robustness.
In addition, HDBSCAN differentiates between noise and meaningful clusters by taking into account points with the low densities or the ones not belonging to any cluster. HDBSCAN captures and eliminates the noise by constantly adjusting the minimum cluster size parameter and adding a minimum spanning tree.
Parameters of HDBSCAN
HDBSCAN has a number of parameters that can be adjusted to modify the clustering process to the specific dataset. Here are some of the main paramters:
- ‘min_cluster_size’: This parameter sets the minimum number of points required to form a cluster. Points that do not meet this criterion are consiered noise. Adjusting this paramater influences the granularity of the clusters found by the algoirthm.
- ‘min_samples’: It sets the minimum nmber of samles in a neighborhood for a point to be considered a core point.
- ‘cluster_selection_epsilon’: This parameter sets the epsilon value for selecting clusters based on the minimum spanning tree. It determines the maximum distances allowed between the points for them to be considered connected in the density-based clustering process.
- ‘metric’: The distance metric to use for computing mutual reachability distance.
- ‘cluster_selection_method’: This method is used to choose clusters from the condensed tree. It can be ‘eom'(Excess of Mass’), ‘leaf’ (cluster Tree Leaf) , ‘Leaf-dm'(Leaf with Distance Metric) or ‘flat'(Flat clustering).
- ‘alpha’: A parameter that influcences the linkage criterion for clustering merging.
- ‘gen_min_span_tree’: If the parameter is true, it generate the minimum spanning tree for later use.
- ‘metric_params’: It is an additional keyword arguments for the metric function.
- ‘algorithm’: The algorithm to use fo the mutual reachibility distance computation. Options include ‘best’, ‘generic’, ‘prime_kdtree’, and ‘boruvka_kdtree’.
- ‘core_distance_n_jobs’: The number of parallel jobs to run for core distance calculation.
- ‘allow_single_cluster’: A boolean indicating whether to allow single cluster outputs.
Implementation of HDBSCAN Clustering Algorithm
Installing necessary libraries
pip install hdbscan
Importing Libraries
Let’s see the implementation of HDBSCAN Clustering.
First, we will be importing the necessary libraries that includes numpy, sklearn.datasets, matplolib, hdbscan and metrics like silhouette_score, adjusted rand index for evaluating the metrics.
Python3
import hdbscan
import numpy as np
import matplotlib.pyplot as plt
from sklearn.datasets import make_blobs
from sklearn.metrics import silhouette_score, adjusted_rand_score
Generating Sample dataset
This code snippet creates a synthetic dataset (X) with 1000 data points distributed across five clusters. The clusters have a standard deviation of 0.6, ensuring some variance within each cluster, and are generated using a fixed random seed (random_state=42) to ensure reproducibility.
Python3
# Generate sample data
X, y_true = make_blobs(n_samples=1000, centers=5,
                       cluster_std=0.6, random_state=42)
Applying HDBSCAN with parameters
This code initializes the HDBSCAN clustering algorithm with the following parameters: min_cluster_size specifies the minimum number of samples required to form a cluster, min_samples specifies the minimum number of samples in a neighborhood for a point to be considered a core point, and cluster_selection_method specifies the method used to select clusters from the condensed tree, with ‘eom’ representing Excess of Mass. Other parameters affect the metric, algorithm, leaf size, and whether or not single clusters are allowed.
Python3
# Initialize HDBSCAN with additional parameters
clusterer = hdbscan.HDBSCAN(min_cluster_size=5,
                            min_samples=5,
                            cluster_selection_method='eom',
                            allow_single_cluster=True,
                            metric='euclidean',
                            algorithm='best',
                            leaf_size=30)
Fitting the model
This code applies the initialized HDBSCAN model to the input data X and performs the clustering process.
Python3
# Fit the model to the data
clusterer.fit(X)
Evaluate Clustering
This code assesses the clustering results by calculating the silhouette score and adjusted Rand index. It compares the predicted labels (labels) obtained from clustering to the true labels (y_true), if any, and prints both evaluation metrics.
Python3
# Evaluate clustering
labels = clusterer.labels_
silhouette_avg = silhouette_score(X, labels)
ari = adjusted_rand_score(y_true, labels)

# Evaluation metrics
print("Silhouette Coefficient: {:.2f}".format(silhouette_avg))
print("Adjusted Rand Index: {:.2f}".format(ari))
Output:
Silhouette Coefficient: 0.77
Adjusted Rand Index: 0.99
A Silhouette Coefficient of 0.77 indicates that the clustering is well-separated, with samples being assigned to the correct clusters. An Adjusted Rand Index of 0.99 indicates a very high similarity between the two clusterings being compared. Both metrics suggest that the clustering results are strong.
Visualizing the clusters
Python3
# Visualize the clusters
plt.figure(figsize=(10, 6))
plt.scatter(X[:, 0], X[:, 1], c=clusterer.labels_,
            cmap='viridis', s=50, alpha=0.7, edgecolors='k')
plt.colorbar()
plt.title('HDBSCAN Clustering')
plt.xlabel('Feature 1')
plt.ylabel('Feature 2')
plt.show()
Output:
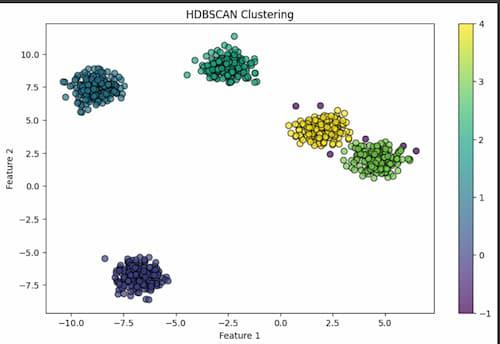
Here, in this code it generates a scatter plot to visualize the clustering results. Each data point is represented by a marker, whose color indicates the cluster label assigned by HDBSCAN. The cmap parameter specifies the colormap for coloring the clusters, while s controls the marker size. Finally, labels, titles, and axes are added to the plot to make it clearer.
Advantages of HDBSCAN Clustering
Some of the advantages of HDBSCAN Clustering are:
- Automatic cluster Discovery: It automatically determines the number of clusters in the dataset without requiring a prior specification, making it suitable for datasets with varying densities and complex structures.
- Handling Cluster Shapes: It can identify clusters of varying shapes and sizes, including clusters that are non-convex and have irregular shapes.
- Hierarchical Clustering: HDBSCAN constructs a hierarchical clustering structure allowing exploration of clusters at different levels of granularity, providing valuable insights into the data’s underlying structure.
Disadvantages of HDBSCAN Clustering
- Computationally Intensive: HDBSCAN can be computationally expensive, particularly for large datasets, due to the construction of the minimum spanning tree and the calculation of mutual reachability distances.
- Sensitive to Distance metric: In HDBSCAN, the distance metric used can influence the clustering results. Some distance metrics may not accurately capture the data’s underlying structure, resulting in suboptimal clustering results.
- Parameter Sensitivity: Although HDBSCAN is less sensitive to parameter settings than some other clustering algorithms, it still requires parameter tuning, particularly for the minimum cluster size and minimum sample parameters, which can influence clustering results.
Share your thoughts in the comments
Please Login to comment...