Handling Missing Values with CatBoost
Last Updated :
30 Nov, 2023
Data is the cornerstone of any analytical or machine-learning endeavor. However, real-world datasets are not perfect yet and they often contain missing values which can lead to error in the training phase of any algorithm. Handling missing values is crucial because they can lead to biased or inaccurate results in data analyses and machine learning models. Strategies for dealing with missing values include imputation (replacing missing values with estimated or calculated values), removal of incomplete records, or the use of advanced techniques like multiple imputation. Addressing missing values is an essential aspect of data cleaning and preparation to ensure robust and reliable analyses. In this article, we will discuss how to handle missing values with the CatBoost model.
What is CatBoost
CatBoost or categorical boosting is a machine learning algorithm developed by Yandex, a Russian multinational IT company. This special boosting algorithm is based on the gradient boosting framework which can handle categorical features more effectively than other traditional gradient boosting algorithms by incorporating techniques like ordered boosting, oblivious trees, and advanced handling of categorical variables to achieve high performance with minimal hyperparameter tuning. CatBoost also has an in-built hyperparameter(nan_mode) to handle missing values present in the dataset which helps us to handle the dataset very effectively without performing other data pre-processing.
What are missing values?
Missing values refer to the absence of data for certain observations or variables in a dataset. These missing values can occur for various reasons, ranging from errors during data collection to intentional omissions. We need to handle them very carefully to achieve an accurate predictive model. Commonly missing values are represented by two ways in datasets which are discussed below–>
- NaN (Not a Number): In numeric datasets, NaN is often used to represent missing or undefined values. NaN is a special floating-point value defined by the IEEE standard which is commonly used in programming languages like Python and libraries like NumPy.
- NULL or NA: In database systems or statistical software, NULL or NA may be used to denote missing values. These are only placeholders which signify the absence of data for a particular observation.
Implementation of Handling Missing Values with CatBoost
Installing required modules
At first, we need to install CatBoost module to our runtime before proceed further.
!pip install catboost
Importing required libraries
Now we will import all required Python libraries like NumPy, Pandas, Matplotlib, Seaborn and SKlearn etc.
Python3
import pandas as pd
import numpy as np
import seaborn as sns
import matplotlib.pyplot as plt
from catboost import CatBoostRegressor, Pool
from sklearn.metrics import mean_absolute_error, r2_score
from sklearn.model_selection import train_test_split
|
Dataset loading
Now we load a dataset from Kaggle. Then we will split it into training and testing sets(80:20) and prepare categorial features which will be feed to the CatBoost during training.
Python3
data = pd.read_csv('train.csv')
features = data.columns.difference(['SalePrice'])
target = 'SalePrice'
categorical_features = data[features].select_dtypes(include=['object']).columns
for feature in categorical_features:
data[feature] = data[feature].astype(str)
X = data[features]
y = data[target]
X_train, X_test, y_train, y_test = train_test_split(X, y, test_size=0.2, random_state=42)
categorical_features_indices = np.where(X.dtypes == 'object')[0]
|
The Kaggle House Prices dataset is loaded and ready for modeling with this line of code. The data is divided into features (X) and the target variable (y) after categorical characteristics are converted to strings. An 80-20 ratio is used to further divide the dataset into training and testing sets. For CatBoost models that need to describe categorical features during training, the variable categorical_features_indices is useful since it specifies the indices of categorical features.
Exploratory Data Analysis
Exploratory Data Analysis(EDA) helps us to gain deeper insights about the dataset.
Checking missing values
This is very related to this article and also important for any dataset. Missing values effects the predictions of the model if not handled correctly. Here, we will see which columns of our dataset contains missing values with total count.
Python3
missing_values = data.isnull().sum().sort_values(ascending=False)
missing_values = missing_values[missing_values > 0]
print("\nColumns with missing values:\n", missing_values)
|
Output:
Columns with missing values:
 PoolQC              1453
MiscFeature     1406
Alley                  1369
Fence                1179
FireplaceQu     690
LotFrontage      259
GarageYrBlt       81
GarageCond     81
GarageType      81
GarageFinish    81
GarageQual      81
BsmtFinType2    38
BsmtExposure   38
BsmtQual           37
BsmtCond          37
BsmtFinType1     37
MasVnrArea        8
MasVnrType         8
Electrical              1
dtype: int64
This code computes the sum of the null values for each column in order to check for missing values in the ‘data’ DataFrame. The columns are then printed with their corresponding counts, but only for those with missing values larger than zero. This is done by sorting the columns in descending order according to the number of missing values.
Distribution of target variable
Visualizing the values distribution of target variable helps us to know if there is any potential errors are associated with the dataset. In our dataset the target variable is ‘SalePrice’.
Python3
plt.figure(figsize=(7, 4))
sns.histplot(data['SalePrice'], kde=True, color='forestgreen')
plt.title('Distribution of SalePrice')
plt.show()
|
Output:
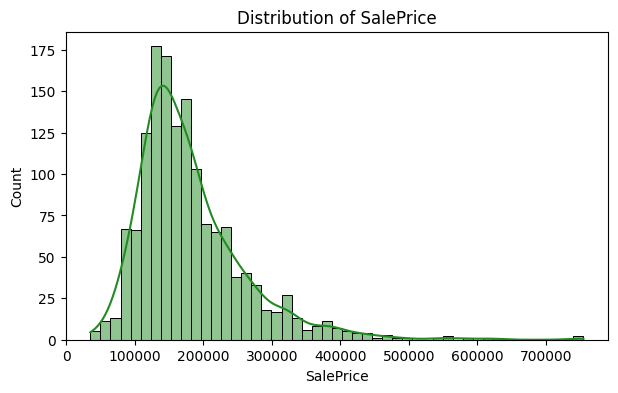
Distribution of target variable(SalePrice)
Using Seaborn, this code generates a histogram that shows the distribution of the ‘SalePrice’ variable in the ‘data’ DataFrame. The histogram gains a smooth depiction of the data distribution when the kde=True parameter is added, adding a Kernel Density Estimate plot.
Model training
Python3
train_pool = Pool(data=X_train, label=y_train, cat_features=categorical_features_indices)
test_pool = Pool(data=X_test, label=y_test, cat_features=categorical_features_indices)
model = CatBoostRegressor(iterations=100, depth=6, learning_rate=0.1, loss_function='RMSE', nan_mode='Min', verbose=False)
model.fit(train_pool)
|
To train the CatBoost model we need to create training and testing pool for CatBoost as its internal training optimization takes special type of dataset type which is different from normal NumPy or pandas data frame. After that we need to specify various hyperparameters to train the CatBoost model. Also here we are going handle missing values with the in-built catboost hyperparameters.
- iterations: This parameter sets the total number of boosting iterations which is the number of trees in the ensemble. Here we will set it to 100 which means the training process will create 100 decision trees (iterations).
- learning_rate: This parameter determines the step size for learning of the gradient boosting algorithm which scales the contribution of each tree to the final prediction. A smaller learning rate usually leads to a more robust model but requires more iterations.
- depth: This parameter controls the maximum depth of the decision trees. A deeper tree can capture more complex patterns but it may lead to overfitting problem.
- verbose: This parameter controls the level of logging and information displayed during training which is useful for monitoring the training process. Here we will set it to ‘False’ to keep the console clear.
- loss_function: This parameter specifies the loss function used to optimize the model during training. It is set to ‘RMSE‘ here as we are performing regression task.
- cat_features: An array of indices for categorical features. CatBoost automatically encodes these features for training and handles them differently.
- nan_mode: This is the special hyperparameter of CatBoost which is used to handle missing values of dataset internally during model training. This hyperparameter takes three values which are ‘Forbidden’, ‘Min’ and ‘Max’. By default it takes ‘Forbidden’ and raises an error during training. If we set it to ‘Min’ then it will replace all missing values with the minimum value of the corresponding column. And if we set it to ‘Max’ then it will replace of missing values with maximum value of the corresponding column. Here we will set it to ‘Min’.
Model evaluation
Now we will evaluate our model in the terms of MAE and R2-score which are most common regression model metrics.
Python3
y_pred = model.predict(test_pool)
mae = mean_absolute_error(y_test, y_pred)
r2 = r2_score(y_test, y_pred)
print(f'Mean Absolute Error (MAE): {mae:.2f}')
print(f'R2 Score: {r2:.4f}')
|
Output:
Mean Absolute Error (MAE): 17666.19
R2 Score: 0.9000
This code uses a pre-trained model (model) to make predictions on the test set. The model’s performance on the test data is then assessed using the Mean Absolute Error (MAE) and R-squared (R2) scores, which offer information on the model’s goodness of fit and accuracy.
Conclusion
We can conclude that missing values are very common in real-world datasets but we need to handle them efficiently as they can degrade the model’s performance. CatBoost has its in-build mechanism to handle missing values in dataset during training. Our model achived a notable R2-Score of 90% which depicts that the missing values are handled efficiently. However, we can perform hyperparameter tuning to achieve more accurate results.
Share your thoughts in the comments
Please Login to comment...