Graph definition & meaning in DSA
Last Updated :
11 Apr, 2023
A Graph is a non-linear data structure consisting of vertices and edges where two vertices are connected by an edge.
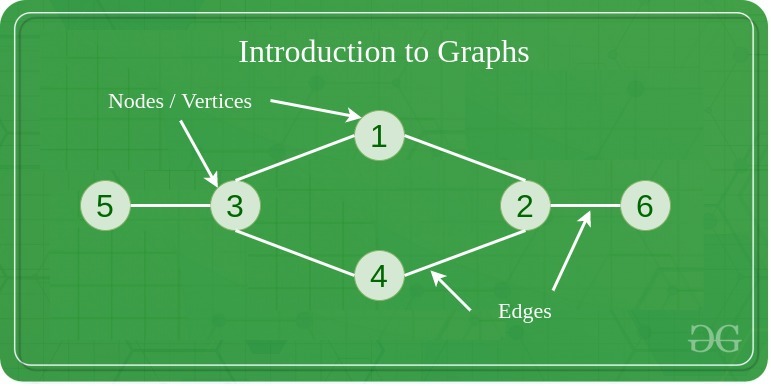
Example of Graph
Properties of a Graph:
- Vertices (nodes): The points where edges meet in a graph are known as vertices or nodes. A vertex can represent a physical object, concept, or abstract entity.
- Edges: The connections between vertices are known as edges. They can be undirected (bidirectional) or directed (unidirectional).
- Degree: The degree of a vertex is the number of edges that connect to it. In a directed graph, the in-degree of a vertex is the number of edges that point to it, and the out-degree is the number of edges that start from it.
- Path: A path is a sequence of vertices that are connected by edges. A simple path does not contain any repeated vertices or edges.
- Cycle: A cycle is a path that starts and ends at the same vertex. A simple cycle does not contain any repeated vertices or edges.
- Connectedness: A graph is said to be connected if there is a path between any two vertices. A disconnected graph is a graph that is not connected.
- Planarity: A graph is said to be planar if it can be drawn on a plane without any edges crossing each other.
- Bipartiteness: A graph is said to be bipartite if its vertices can be divided into two disjoint sets such that no two vertices in the same set are connected by an edge.
Types of Graph:
Based on the directions of edges, graphs can be divided into two categories:
- Directed Graph: If the edges of a graph have a direction associated with them, then it is called a directed graph.
- Undirected Graph: If the edges of the do not have any direction associated with them, it is called an undirected graph.
Based on the weights of edges, a graph can also be classified into two categories:
- Weighted Graph: If the edges of the graph have some weight assigned to them, it is called a weighted graph.
- Unweighted Graph: If the edges do not have any weight assigned to them, it is an unweighted graph.
Application of Graph:
- Social media analysis: Social media platforms generate a vast amount of data in real time, which can be analyzed using graphs to identify trends, sentiment, and key influencers.
- Network monitoring: Graphs can be used to monitor network traffic in real-time, allowing network administrators to identify potential bottlenecks, security threats, and other issues. This is critical for ensuring the smooth operation of complex networks.
- Financial trading: Graphs can be used to analyze real-time financial data, such as stock prices and market trends, to identify patterns and make trading decisions. This is particularly important for high-frequency trading, where even small delays can have a significant impact on profits.
- Autonomous vehicles: Graphs can be used to model the real-time environment around autonomous vehicles, allowing them to navigate safely and efficiently. This requires real-time data from sensors and other sources, which can be processed using graph algorithms.
To see more applications of graphs, refer to this article.
Advantages of Graph:
- Representing complex data: Graphs are effective tools for representing complex data, especially when the relationships between the data points are not straightforward. They can help to uncover patterns, trends, and insights that may be difficult to see using other methods.
- Efficient data processing: Graphs can be processed efficiently using graph algorithms, which are specifically designed to work with graph data structures. This makes it possible to perform complex operations on large datasets quickly and effectively.
- Visualization: Graphs are highly visual, making it easy to communicate complex data and relationships in a clear and concise way. This makes them useful for presentations, reports, and data analysis.
- Machine learning: Graphs can be used in machine learning to model complex relationships between variables, such as in recommendation systems or fraud detection.
To see more advantages of graph, refer to this article.
Disadvantages of Graph:
- Limited representation: Graphs can only represent relationships between objects, and not their properties or attributes. This means that in order to fully understand the data, it may be necessary to supplement the graph with additional information.
- Difficulty in interpretation: Graphs can be difficult to interpret, especially if they are large or complex. This can make it challenging to extract meaningful insights from the data, and may require advanced analytical techniques or domain expertise.
- Scalability issues: As the number of nodes and edges in a graph increases, the processing time and memory required to analyze it also increases. This can make it difficult to work with large or complex graphs.
To learn more about disadvantages of graph, refer to this article.
What else can you read?
Share your thoughts in the comments
Please Login to comment...