Estimation of Variable | set 2
Last Updated :
05 Aug, 2022
Prerequisite: Estimation of Variable | set 1
Terms related to Variability Metrics :
-> Deviation
-> Variance
-> Standard Deviation
-> Mean Absolute Deviation
-> Median Absolute Deviation
-> Order Statistics
-> Range
-> Percentile
-> Inter-quartile Range
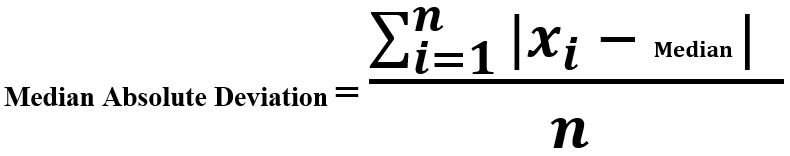
- Median Absolute Deviation: Mean Absolute Deviation, Variance, and Standard deviation (discussed in the previous section) are not robust to extreme values and outliers. We average the sum of deviations from the median.
Sequence : [2, 4, 6, 8]
Mean     = 5
Deviation around mean = [-3, -1, 1, 3]

Mean Absolute Deviation = (3 + 1 + 1 + 3)/ 4
Python3
import numpy as np
def mad(data):
return np.median(np.absolute(
data - np.median(data)))
Sequence = [2, 4, 10, 6, 8, 11]
print ("Median Absolute Deviation : ", mad(Sequence))
|
Output :
Median Absolute Deviation : 3.0
- Order Statistics: This variability measurement approach is based on the spread of ranked (sorted) data.
- Range: It is the most basic measurement belonging to Order Statistics. It is the difference between the largest and the smallest value of the dataset. It is good to know the spread of data but it is very sensitive to outliers. We can make it better by dropping the extreme values.
Example :
Sequence : [2, 30, 50, 46, 37, 91]
Here, 2 and 91 are outliers

Range = 91 - 2 = 89
Range without outliers = 50 - 30 = 20
- Percentile: It is a very good measure to measure the variability in data, avoiding outliers. The Pth percentile in data is a value such that atleast P% or fewer values are lesser than it and atleast (100 – P)% values are more than P.
The Median is the 50th percentile of the data.
Example :
Sequence : [2, 30, 50, 46, 37, 91]
Sorted   : [2, 30, 37, 46, 50, 91]

50th percentile = (37 + 46) / 2 = 41.5
Python3
import numpy as np
Sequence = [2, 30, 50, 46, 37, 91]
print ("50th Percentile : ", np.percentile(Sequence, 50))
print ("60th Percentile : ", np.percentile(Sequence, 60))
|
Output :
50th Percentile :  41.5
60th Percentile :  46.0
- Inter-Quartile Range(IQR): It works for the ranked(sorted data). It has 3 quartiles dividing data – Q1(25th percentile), Q2(50th percentile), and Q3(75th percentile). Inter-quartile Range is the difference between Q3 and Q1.
Example :
Sequence : [2, 30, 50, 46, 37, 91]
Q1 (25th percentile) : 31.75
Q2 (50th percentile) : 41.5
Q3 (75th percentile) : 49

IQR = Q3 - Q1 = 17.25
Python3
import numpy as np
from scipy.stats import iqr
Sequence = [2, 30, 50, 46, 37, 91]
print ("IQR : ", iqr(Sequence))
|
Output :
IQR : 17.25
Python3
import numpy as np
iqr = np.subtract(*np.percentile(Sequence, [75, 25]))
print ("\nIQR : ", iqr)
|
Output :
IQR : 17.25
Share your thoughts in the comments
Please Login to comment...