Emergence of connectedness in Social Networks
Last Updated :
29 Aug, 2020
Prerequisite: Basics of NetworkX
The emergence of connectedness is to check whether the graph is connected or not. It says that in a graph of N nodes, we just need NLogN edges to make graph connected.
Approach:
The following algorithm to be followed:
- Take any random graph with N number of nodes.
- Now choose any node as a starting node.
- Now add random edges to the graph and check every time if the graph is connected or not.
- If the graph is not connected then repeat steps 2 and 3.
- If the graph is connected then check the number of edges that are added and this will be equal to NLogN.
- Now check both the plots will be almost similar.
Code for Checking connectedness:
Python3
import networkx as nx
import matplotlib.pyplot as plt
import random
def add_nodes(N):
g = nx.Graph()
g.add_nodes_from(range(N))
return g
def add_random_edge(g):
z1 = random.choice(g.nodes())
z2 = random.choice(g.nodes())
if z1 != z2:
g.add_edge(z1, z2)
return g
def continue_add_connectivity(g):
while(nx.is_connected(g) == False):
g = add_random_edge(g)
return g
def create_instance(N):
g = add_nodes(N)
g = continue_add_connectivity(g)
return g.number_of_edges()
def create_average_instance(N):
l = []
for i in range(0, 100):
l.append(create_instance(N))
return numpy.average(l)
def plot_connectivity():
a = []
b = []
j = 10
while (j <= 1000):
a.append(j)
b.append(create_average_instance(j))
i += 10
plt.xlabel('Number of nodes')
plt.ylabel('Number of edges required')
plt.title('Emergence of connectivity')
plt.plot(a, b)
plt.show()
a1 = []
b1 = []
j = 10
while (j <= 400):
a1.append(j)
b1.append(j*float(numpy.log(j)/2))
j += 10
plt.plot(a1, b1)
plt.show()
plot_connectivity()
|
Output:
10
20
30
40
50
60
70
80
90
100
110
120
130
140
150
160
170
180
190
200
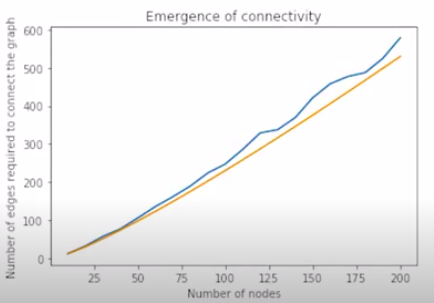
Plot of Emergence of Connectedness
Share your thoughts in the comments
Please Login to comment...