Dollar Sign in R
Last Updated :
21 Feb, 2024
R programming language is widely known for its powerful features and a vast collection of packages what makes R stand out is its use of the dollar sign ($) as a special symbol. This symbol plays a big role in helping users grab specific pieces of information from tables (data frames) and lists.
What is a Dollar Sign?
In programming languages like R, the Dollar sign ($) helps us work with lists and data frames effortlessly. Just like using [] brackets, the $ sign allows us to manipulate data in a named list or access columns in a data frame.
How to Use Dollar Sign ($) Operator in R
Consider a data frame named “df” with columns “age,” “income,” and “gender.”
R
df <- data.frame(
age = c(25, 30, 35, 40),
income = c(50000, 60000, 75000, 90000),
gender = c("Male", "Female", "Male", "Female")
)
df
|
Output:
  age income gender
1  25  50000   Male
2  30  60000 Female
3  35  75000   Male
4  40  90000 Female
Accesing Element by using $ sign in Data Frame
R
income_column <- df$income
print(income_column)
|
Output:
[1] 50000 60000 75000 90000
Add New Element Using $ Sign in Data Frame
R
df$education <- c("High School", "Bachelor's", "Master's", "PhD")
print(df)
|
Output:
  age income gender   education
1  25  50000   Male High School
2  30  60000 Female  Bachelor's
3  35  75000   Male    Master's
4  40  90000 Female         PhD
Delete Element From Data Frame
Output:
  income gender   education
1  50000   Male High School
2  60000 Female  Bachelor's
3  75000   Male    Master's
4  90000 Female         PhD
Dollar Sign in R Lists
Suppose we have Creating a list named “my_list” with elements “a,” “b,” and “c.”
R
my_list <- list(
a = 10,
b = "Hello",
c = c(1, 2, 3)
)
my_list
|
Output:
$a
[1] 10

$b
[1] "Hello"

$c
[1] 1 2 3
Access Element by Using $ Sign in List
R
element_b <- my_list$b
print(element_b)
|
Output:
[1] "Hello"
Add New Element Using $ Sign in List
R
my_list <- list(
a = 10,
b = "Hello",
c = c(1, 2, 3)
)
my_list$d <- "New Element"
print(my_list)
|
Output:
$a
[1] 10

$b
[1] "Hello"

$c
[1] 1 2 3

$d
[1] "New Element"
Delete Element from List
R
my_list <- list(
a = 10,
b = "Hello",
c = c(1, 2, 3)
)
my_list$b <- NULL
print(my_list)
|
Output:
$a
[1] 10

$c
[1] 1 2 3
Now we’ll work with a data frame containing information about sales in different regions and leverage the dollar sign to perform advanced operations.
Consider a data frame named `sales_data`.
R
sales_data <- data.frame(
Region = c("North", "South", "East", "West"),
Q1_Sales = c(500000, 600000, 450000, 700000),
Q2_Sales = c(550000, 620000, 480000, 720000),
Expenses = c(200000, 250000, 180000, 300000)
)
print("Original Sales Data:")
print(sales_data)
|
Output:
[1] "Original Sales Data:"
  Region Q1_Sales Q2_Sales Expenses
1  North   500000   550000   200000
2  South   600000   620000   250000
3   East   450000   480000   180000
4   West   700000   720000   300000
Calculate Profit for Each Region
R
sales_data <- data.frame(
Region = c("North", "South", "East", "West"),
Q1_Sales = c(500000, 600000, 450000, 700000),
Q2_Sales = c(550000, 620000, 480000, 720000),
Expenses = c(200000, 250000, 180000, 300000)
)
sales_data$Profit <- sales_data$Q1_Sales + sales_data$Q2_Sales - sales_data$Expenses
print("\nSales Data with Profit:")
print(sales_data)
|
Output:
[1] "Sales Data with Profit:"

  Region Q1_Sales Q2_Sales Expenses  Profit
1  North   500000   550000   200000  850000
2  South   600000   620000   250000  970000
3   East   450000   480000   180000  750000
4   West   700000   720000   300000 1120000
In this example, the dollar sign is used to create a new variable, “Profit,” by subtracting the total expenses from the combined sales for each region.
Identify Regions with Above-Average Profit
R
sales_data <- data.frame(
Region = c("North", "South", "East", "West"),
Q1_Sales = c(500000, 600000, 450000, 700000),
Q2_Sales = c(550000, 620000, 480000, 720000),
Expenses = c(200000, 250000, 180000, 300000)
)
sales_data$Profit <- sales_data$Q1_Sales + sales_data$Q2_Sales - sales_data$Expenses
average_profit <- mean(sales_data$Profit)
above_average_profit_regions <- sales_data$Region[sales_data$Profit > average_profit]
print("\nRegions with Above-Average Profit:")
print(above_average_profit_regions)
|
Output:
[1] "Regions with Above-Average Profit:"

[1] "South" "West"
The dollar sign is utilized to filter and extract regions with profits above the calculated average profit. sales_data$Profit > average_profit filters the data based on the calculated profit, and sales_data$Region extracts the corresponding region names.
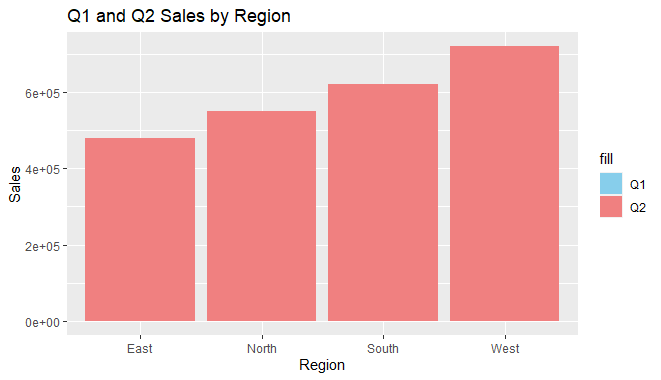
Visualizing Sales Data
R
library(ggplot2)
sales_data <- data.frame(
Region = c("North", "South", "East", "West"),
Q1_Sales = c(500000, 600000, 450000, 700000),
Q2_Sales = c(550000, 620000, 480000, 720000),
Expenses = c(200000, 250000, 180000, 300000)
)
sales_data$Profit <- sales_data$Q1_Sales + sales_data$Q2_Sales - sales_data$Expenses
average_profit <- mean(sales_data$Profit)
above_average_profit_regions <- sales_data$Region[sales_data$Profit > average_profit]
ggplot(sales_data, aes(x = Region)) +
geom_bar(aes(y = Q1_Sales, fill = "Q1"), position = "dodge", stat = "identity") +
geom_bar(aes(y = Q2_Sales, fill = "Q2"), position = "dodge", stat = "identity") +
labs(title = "Q1 and Q2 Sales by Region", y = "Sales") +
scale_fill_manual(values = c("Q1" = "skyblue", "Q2" = "lightcoral"))
|
Output:
Dollar Sign in R
Here, the dollar sign is used to access the “Region,” “Q1_Sales,” and “Q2_Sales” columns for creating a bar plot using the ggplot2 library. In this example, the dollar sign is used in creating new variables, performing calculations, filtering data, and even creating visualizations it shows the versatility and power of the dollar sign operator in data analysis.
Conclusion
In R programming, the dollar sign serves as a versatile and powerful operator for extracting, manipulating, and creating variables within data frames, lists, and environments. Its concise syntax enhances the readability of code and contributes to the efficiency of data analysis workflows.
Share your thoughts in the comments
Please Login to comment...