Debugging in Google Colab
Last Updated :
27 Nov, 2023
Having a debugger is a must while dealing with some complex or large problems that require a lot of lines of code and complexity associated with it. Although most renowned IDEs like VS Code, PyCharm, and IntelliJ have their Debuggers preinstalled with them, those who use third-party applications online like Google Colab, find it difficult to debug their code. print() statement can’t always come in handy in the case of large and complex programs like Machine Learning or Deep Learning tasks. In this article, we will see how we can easily debug our code in Google Colab by using a library specially created for this purpose.
Required Modules
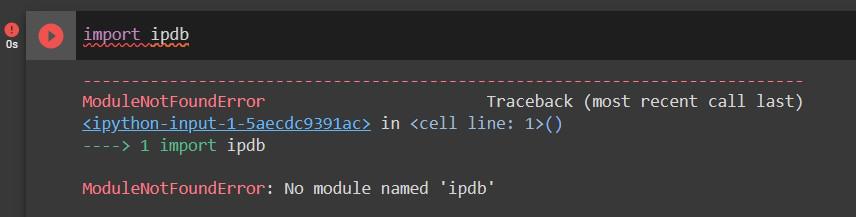
We will use a module named ipdb to debug our code in Google Colab, it doesn’t come pre-installed so we need to install it via pip. If the user wants they can try to import the module to check if it is pre-installed or not, they will get a similar output as below –
Installing the Module
Type the following command in the Code section and run that particular cell.
!pip install ipdb
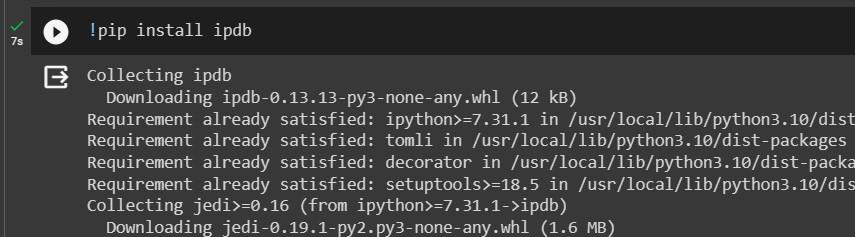
Now re-run the previous cell to check if it has successfully installed or not. If there is no error, then it has been installed successfully.
Enabling Automatic Debugger Calling
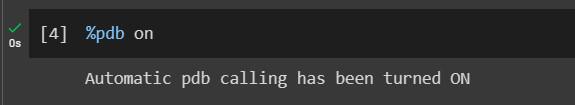
IPDB offers a great feature in which the user can just on the automatic debugger, so that if there is any error in the code, after running that code cell the debugger will automatically become active and respond to that error, even if we haven’t called it nor used it anywhere inside the code. To do that write the below command and run that cell
%pdb on
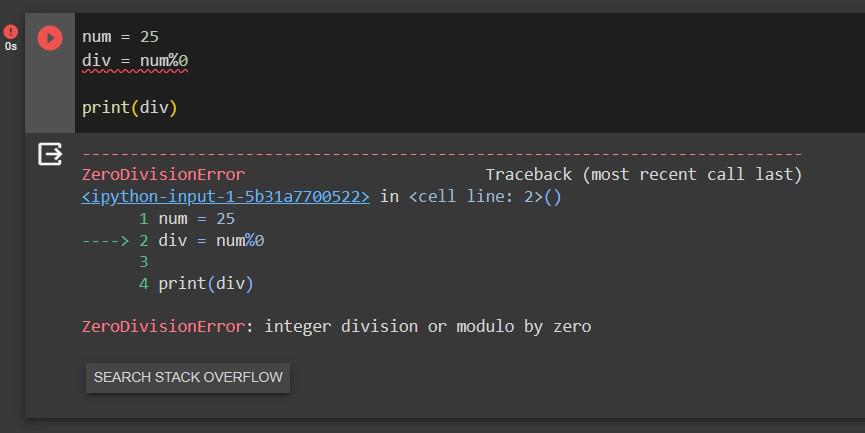
Now we will deliberately write a code with an error in it and see how pdb reacts, we will also see an instance where pdb is not on and see the difference between the outputs
Python3
num = 25
div = num%0
print(div)
|
We will be using the above code as a template for both pdb on and pdb off purpose.
Output when PDB is ON
When PDB is on, we will get the following output of the above code.
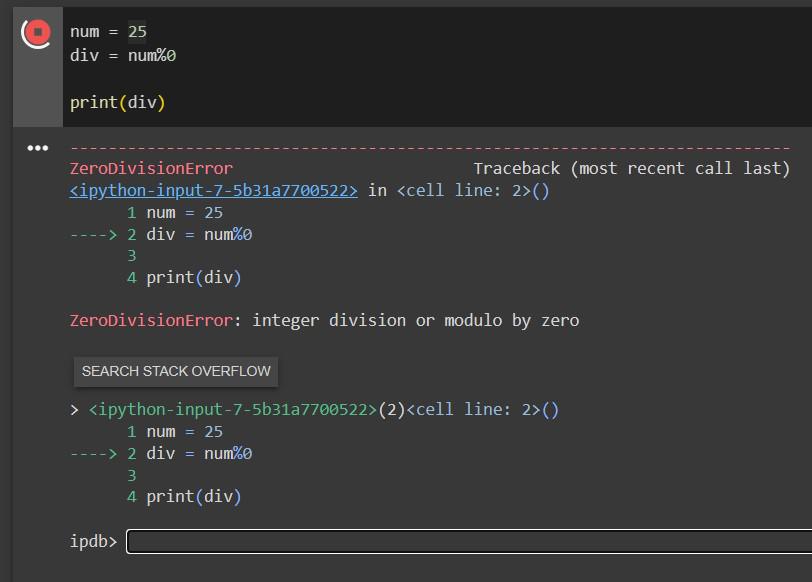
As we can see, apart from the Error there is a different section with ipdb> notation which is showing where the error is and waiting for the suitable command to debug it, the code will not stop executing until we write q and press Enter to stop the debugger. There are a list of commands supported by PDB, we will see the list later.
Output when PDB is off
When the PDB is off and we are using a normal cell, the output of the same code will be different, there will be no extra section to debug it, just the error and the code will stop executing immediately.
Here There is no extra section related to the Debugger, nor the code is executing even after finding an error.
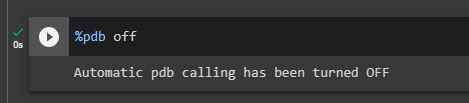
How to stop Automatic Debugging?
After executing %pdb on, for the entire session that pdb will work for all the cells, to stop this the user need to type and execute the following in a cell.
%pdb off
Adding a Breakpoint
Adding a Breakpoint in between a large and complex code is a common practice, developers put breakpoint in some strategic points of the code where they think an error might occur. Adding a breakpoint will cause the code to stop executing at that certain point. Adding a breakpoint helps the developer understanding why some of the test cases are running and some are not as the execution will stop prematurely.
The module has a method named set_trace() which is used to set breakpoints in code. It generally takes no parameter to work, but if the developer wants, they can pass a parameter called context and a number, this context is used to provide some lines above or below the point which is causing the error, this is helpful while dealing with a longer and complex code as without understanding the context, developers can fix that because it may happen that after fixing that error a new error arises.
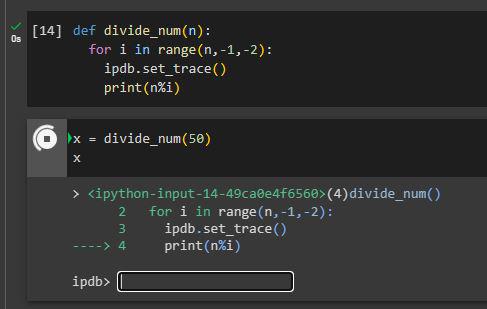
set_trace() method without context
As we can see without giving any context the method is printing only the for loop, in which the error resides.
Python3
def divide_num(n):
for i in range(n,-1,-2):
ipdb.set_trace()
print(n%i)
x = divide_num(50)
print(x)
|
Output
set_trace() method with context
Here we can clearly see there is a difference between the two outputs, in the above one, as context is given as 5, pdb is printing total 5 lines surrounding the one in which the error resides. This helps in understanding the surroundings of the line in which the problem is occurring and rectify it so that no other error arises.
Python3
def divide_num(n):
for i in range(n,-1,-2):
ipdb.set_trace(context=5)
print(n%i)
x = divide_num(50)
x
|
Output

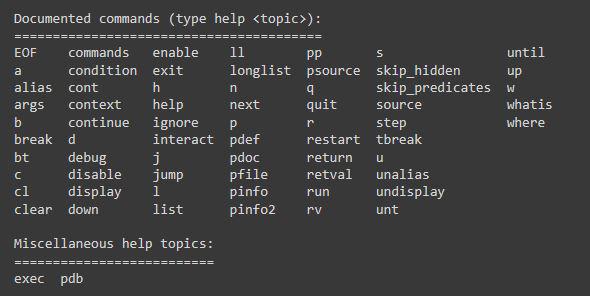
IPDB Commands
There are certain commands used in IPDB to manipulate the debugger as the developer wants. The mostly used commands and their usage is given below in a tabular format.
|
To show all the commands supported by IPDB.
|
|
This shows the details of the COMMAND passed after h. It bascially means “Help COMMAND”
|
|
This means continue the execution until there is another breakpoint
|
|
Go to the next line
|
|
Step into the next code / function
|
|
Continue exceuting the code until face another breakpoint or end of the Code (return statement)
|
|
It is the alternative of the “context” used in set_trace(), it also shows the surroundings of the code
|
|
Shows all the stack traces
|
|
List of Arguments passed while calling the function (if there is a function in the code)
|
|
Stop the Debugger and the execution of that cell
|
There are so many other commands that are available in IPDB, the above table consists of only the commands that are mostly used. The below picture shows all the list of commands available
Share your thoughts in the comments
Please Login to comment...