DataFrames are generic data objects of R which are used to store the tabular data. Data frames are considered to be the most popular data objects in R programming because it is more comfortable to analyze the data in the tabular form. Data frames can also be taught as mattresses where each column of a matrix can be of the different data types. DataFrame are made up of three principal components, the data, rows, and columns.

Operations that can be performed on a DataFrame are:
- Creating a DataFrame
- Accessing rows and columns
- Selecting the subset of the data frame
- Editing dataframes
- Adding extra rows and columns to the data frame
- Add new variables to dataframe based on existing ones
- Delete rows and columns in a data frame
Creating a DataFrame
In the real world, a DataFrame will be created by loading the datasets from existing storage, storage can be SQL Database, CSV file, and an Excel file. DataFrame can also be created from the vectors in R. Following are some of the various ways that can be used to create a DataFrame:
Creating a data frame using Vectors: To create a data frame we use the data.frame() function in R. To create a data frame use data.frame() command and then pass each of the vectors you have created as arguments to the function.
Example:
Python3
Name = c("Amiya", "Raj", "Asish")
Language = c("R", "Python", "Java")
Age = c(22, 25, 45)
df = data.frame(Name, Language, Age)
print(df)
|
Output:
  Name  Language  Age
1 Amiya        R  22
2   Raj   Python  25
3 Asish     Java  45
Creating a data frame using data from a file: Dataframes can also be created by importing the data from a file. For this, you have to use the function called ‘read.table()‘.
Syntax:
newDF = read.table(path="Path of the file")
To create a dataframe from a CSV file in R:
Syntax:
newDF = read.csv("FileName.csv")
Accessing rows and columns
The syntax for accessing rows and columns is given below,
df[val1, val2]

df = dataframe object
val1 = rows of a data frame
val2 = columns of a data frame
So, this ‘val1‘ and ‘val2‘ can be an array of values such as “1:2” or “2:3” etc. If you specify only df[val2] this refers to the set of columns only, that you need to access from the data frame.
Example: Row selection
Python3
df = data.frame(
"Name" = c("Amiya", "Raj", "Asish"),
"Language" = c("R", "Python", "Java"),
"Age" = c(22, 25, 45)
)
print(df)
cat("Accessing first and second row\n")
print(df[1:2, ])
|
Output:
   Name Language Age
1 Amiya        R  22
2   Raj   Python  25
3 Asish     Java  45

Accessing first and second row
   Name Language Age
1 Amiya        R  22
2   Raj   Python  25
Example: Column selection
Python3
df = data.frame(
"Name" = c("Amiya", "Raj", "Asish"),
"Language" = c("R", "Python", "Java"),
"Age" = c(22, 25, 45)
)
print(df)
cat("Accessing first and second column\n")
print(df[, 1:2])
|
Output:
   Name Language Age
1 Amiya        R  22
2   Raj   Python  25
3 Asish     Java  45

Accessing first and second column
   Name Language
1 Amiya        R
2   Raj   Python
3 Asish     Java
Selecting the subset of the DataFrame
A subset of a DataFrame can also be created based on certain conditions with the help of following syntax.
newDF = subset(df, conditions)
df = Original dataframe
conditions = Certain conditions
Example:
Python3
df = data.frame(
"Name" = c("Amiya", "Raj", "Asish"),
"Language" = c("R", "Python", "Java"),
"Age" = c(22, 25, 45)
)
print(df)
newDf = subset(df, Name =="Amiya"|Age>30)
cat("After Selecting the subset of the data frame\n")
print(newDf)
|
Output:
Name Language Age
1 Amiya        R  22
2   Raj   Python  25
3 Asish     Java  45

After Selecting the subset of the data frame
   Name Language Age
1 Amiya        R  22
3 Asish     Java  45
Editing DataFrames
In R, DataFrames can be edited in two ways:
Editing data frames by direct assignments: Much like the list in R you can edit the data frames by a direct assignment.
Example:
Python3
df = data.frame(
"Name" = c("Amiya", "Raj", "Asish"),
"Language" = c("R", "Python", "Java"),
"Age" = c(22, 25, 45)
)
cat("Before editing the dataframe\n")
print(df)
df[[3]][3] = 30
cat("After edited the dataframe\n")
print(df)
|
Output:
Before editing the data frame
   Name Language Age
1 Amiya        R  22
2   Raj   Python  25
3 Asish     Java  45

After edited the data frame
   Name Language Age
1 Amiya        R  22
2   Raj   Python  25
3 Asish     Java  30
Editing dataframes using the edit() command:
Follow the given steps to edit a DataFrame:
Step 1: So, what you need to do for this is you have to create an instance of data frame, for example, you can see that here an instance of a data frame is created and named as “myTable” by using the command data.frame() and this creates an empty data frame.
myTable = data.frame()
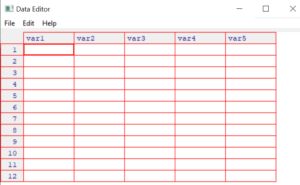
Step 2: Next we will use the edit function to launch the viewer. Note that “myTable” data frame is passed back to the “myTable” object and this way the changes we make to this module will be saved to the original object.
myTable = edit(myTable)
So, when the above command is executed it will pop up a window like this,
Step 3: Now, the table is completed with this small roster.
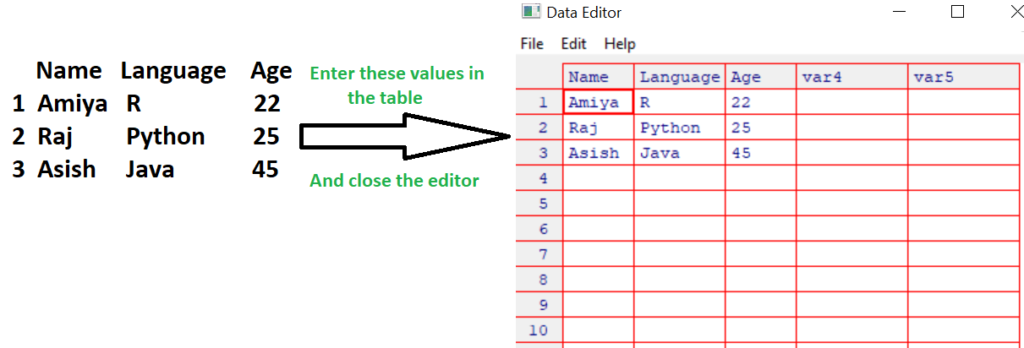
Note that, change variable names by clicking on their labels and typing your changes. Variables can also be set as numeric or character. Once the data in the DataFrame looks like the above, close the table. Changes are saved automatically.
Step 4: Check out the resulting data frame by printing it.
> myTable
   Name Language Age
1 Amiya        R  22
2   Raj   Python  25
3 Asish     Java  45
Adding rows and columns to the data frame
Adding extra rows: We can add extra row using the command rbind(). The syntax for this is given below,
newDF = rbind(df, the entries for the new row you have to add )
df = Original data frame
Note that the entries for the new row you have to add you have to be careful when using rbind() because the data types in each column entry should be equal to the data types that are already existing rows.
Example:
Python3
df = data.frame(
"Name" = c("Amiya", "Raj", "Asish"),
"Language" = c("R", "Python", "Java"),
"Age" = c(22, 25, 45)
)
cat("Before adding row\n")
print(df)
newDf = rbind(df, data.frame(Name = "Sandeep",
Language = "C",
Age = 23
))
cat("After Added a row\n")
print(newDf)
|
Output:
Before adding row
   Name Language Age
1 Amiya        R  22
2   Raj   Python  25
3 Asish     Java  45

After Added a row
     Name Language Age
1   Amiya        R  22
2     Raj   Python  25
3   Asish     Java  45
4 Sandeep        C  23
Adding extra columns: We can add extra column using the command cbind(). The syntax for this is given below,
newDF = cbind(df, the entries for the new column you have to add )
df = Original data frame
Example:
Python3
df = data.frame(
"Name" = c("Amiya", "Raj", "Asish"),
"Language" = c("R", "Python", "Java"),
"Age" = c(22, 25, 45)
)
cat("Before adding column\n")
print(df)
newDf = cbind(df, Rank=c(3, 5, 1))
cat("After Added a column\n")
print(newDf)
|
Output:
Before adding column
   Name Language Age
1 Amiya        R  22
2   Raj   Python  25
3 Asish     Java  45

After Added a column
   Name Language Age Rank
1 Amiya        R  22    3
2   Raj   Python  25    5
3 Asish     Java  45    1
Adding new variables to DataFrame
In R, we can add new variables to a data frame based on existing ones. To do that we have to first call the dplyr library using the command library() . And then calling mutate() function will add extra variable columns based on existing ones.
Syntax:
library(dplyr)
newDF = mutate(df, new_var=[existing_var])
df = original data frame
new_var = Name of the new variable
existing_var = The modify action you are taking(e.g log value, multiply by 10)
Example:
Python3
library(dplyr)
df = data.frame(
"Name" = c("Amiya", "Raj", "Asish"),
"Language" = c("R", "Python", "Java"),
"Age" = c(22, 25, 45)
)
cat("Original Dataframe\n")
print(df)
newDf = mutate(df, log_Age = log(Age))
cat("After creating extra variable column\n")
print(newDf)
|
Output:
Original Dataframe
   Name Language Age
1 Amiya        R  22
2   Raj   Python  25
3 Asish     Java  45

After creating extra variable column
   Name Language Age  log_Age
1 Amiya        R  22 3.091042
2   Raj   Python  25 3.218876
3 Asish     Java  45 3.806662
Deleting rows and columns from a data frame
To delete a row or a column, first of all, you need to access that row or column and then insert a negative sign before that row or column. It indicates that you had to delete that row or column.
Syntax:
newDF = df[-rowNo, -colNo]
df = original data frame
Example:
Python3
df = data.frame(
"Name" = c("Amiya", "Raj", "Asish"),
"Language" = c("R", "Python", "Java"),
"Age" = c(22, 25, 45)
)
cat("Before deleting the 3rd row and 2nd column\n")
print(df)
newDF = df[-3, -2]
cat("After Deleted the 3rd row and 2nd column\n")
print(newDF)
|
Output:
Before deleting the 3rd row and 2nd column
   Name Language Age
1 Amiya        R  22
2   Raj   Python  25
3 Asish     Java  45
After Deleted the 3rd row and 2nd column
   Name Age
1 Amiya  22
2   Raj  25
Share your thoughts in the comments
Please Login to comment...