Create a Donut Chart using Recharts in ReactJS
Last Updated :
10 Nov, 2023
Creating a Donut Chart using Recharts in ReactJS is an effective way to visualize the data. Recharts is a library that is used for creating charts for React JS. This library is used for building Line charts, Bar charts, Pie charts, etc, with the help of React and D3 (Data-Driven Documents).
Donut Charts: Donut charts are the modified version of Pie Charts with the area of center cut out. A donut is more concerned about the use of an area of arcs to represent the information in the most effective manner instead of a Pie chart which is more focused on comparing the proportion area between the slices.
Prerequisites:
Approach:
To create a Donut Chart using Recharts, we create a dataset that contains actual data. Then we define the slices using the donut element with data property which will have the data of the dataset created and with datakey property which is the property name with a value for the slices.
Steps to Create React Application And Installing Module:
Step 1: Create a React application using the following command.
npx create-react-app foldername
Step 2: After creating your project folder i.e. foldername, move to it using the following command.
cd foldername
Step 3: After creating the ReactJS application, Install the required modules using the following command.
npm i --save recharts
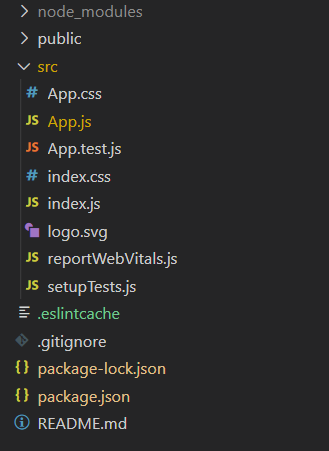
Project Structure:

The updated dependencies in package.json file will look like.
"dependencies": {
        "@testing-library/jest-dom": "^5.17.0",
        "@testing-library/react": "^13.4.0",
        "@testing-library/user-event": "^13.5.0",
        "react": "^18.2.0",
        "react-dom": "^18.2.0",
        "react-scripts": "5.0.1",
        "recharts": "^2.9.3",
        "web-vitals": "^2.1.4
}
Example: Now write down the following code in the App.js file. Here, App is our default component where we have written our code.
Javascript
import React from "react";
import { PieChart, Pie, Tooltip } from "recharts";
const App = () => {
const data = [
{ name: "Geeksforgeeks", students: 400 },
{ name: "Technical scripter", students: 700 },
{ name: "Geek-i-knack", students: 200 },
{ name: "Geek-o-mania", students: 1000 },
];
return (
<div
style={{
textAlign: "center",
margin: "auto 10%",
}}
>
<h1 style={{ color: "green" }}>
GeeksforGeeks
</h1>
<h3>
React JS example for donut chart using
Recharts
</h3>
<PieChart width={700} height={700}>
<Tooltip />
<Pie
data={data}
dataKey="students"
outerRadius={250}
innerRadius={150}
fill="green"
label={({ name, students }) =>
`${name}: ${students}`
}
/>
</PieChart>
</div>
);
};
export default App;
|
Step to Run Application: Run the application using the following command from the root directory of the project:
npm start
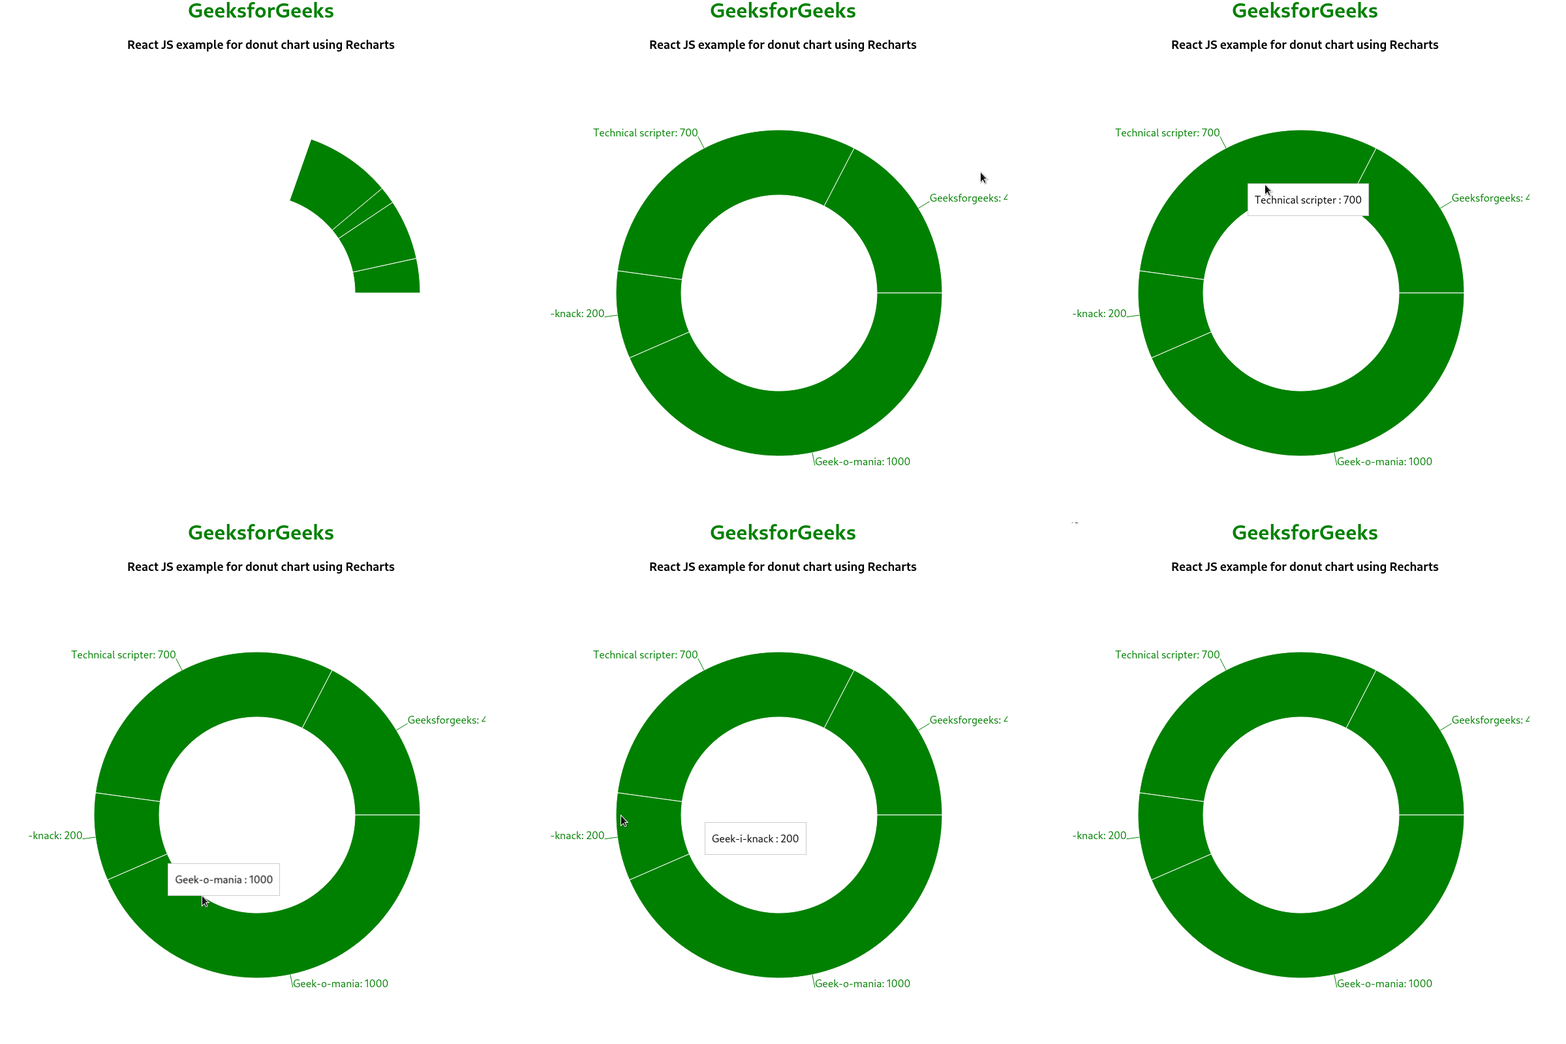
Output: Now open your browser and go to http://localhost:3000/, you will see the following output:

Share your thoughts in the comments
Please Login to comment...