Create a Radar Chart using Recharts in ReactJS
Last Updated :
28 Nov, 2023
Radar charts, also known as spider or star charts, provide a powerful way to display data having multiple variable in a circular layout. Recharts is a popular charting library that is used for creating charts for React JS, provides an easy and efficient method to implement radar charts within your React applications.
Prerequisites:
- Basic understanding of ReactJS and its concepts.
- A React project set up with Recharts installed.
Approach: To create Radar chart using Recharts, we create a dataset with label and polar coordinate details. Then we create a polar grid and both axes i.e. polarAngle axis and polarRadius axis using data coordinates. Finally using the Radar element draws the Radar plot.
Creating React Application And Installing Module:
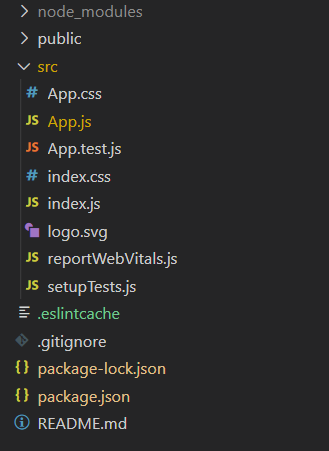
Project Structure:

Example: Now write down the following code in the App.js file. Here, App is our default component where we have written our code.
App.js
import React from 'react';
import { Radar, RadarChart, PolarGrid,
PolarAngleAxis, PolarRadiusAxis } from 'recharts';
const App = () => {
const data = [
{ name: 'A', x: 21 },
{ name: 'B', x: 22 },
{ name: 'C', x: -32 },
{ name: 'D', x: -14 },
{ name: 'E', x: -51 },
{ name: 'F', x: 16 },
{ name: 'G', x: 7 },
{ name: 'H', x: -8 },
{ name: 'I', x: 9 },
];
return (
<RadarChart height={500} width={500}
outerRadius="80%" data={data}>
<PolarGrid />
<PolarAngleAxis dataKey="name" />
<PolarRadiusAxis />
<Radar dataKey="x" stroke="green"
fill="green" fillOpacity={0.5} />
</RadarChart>
);
}
export default App;
|
Step to Run the Application: Run the application using the following command from the root directory of the project:
npm start
Output: Now open your browser and go to http://localhost:3000/, you will see the following output:

Radar chart
Like Article
Suggest improvement
Share your thoughts in the comments
Please Login to comment...