Context Diagrams
Last Updated :
21 Mar, 2024
Context diagrams serve as a foundational tool, helping designers and stakeholders grasp the scope and boundaries of a system under consideration. These diagrams provide a high-level view, illustrating how the system interacts with external entities and the environment. This article explores the significance of context diagrams in system design, their key components, and how to create them.

Important Topics for Context Diagrams
What are Context Diagrams?
Context Diagrams are high-level visual representations that show the interactions between a system being developed and its external entities, such as users, other systems, or processes. They provide a big-picture view of how the system fits into its environment without diving into the internal details of the system itself.
- Typically, they consist of a central system surrounded by external entities, with arrows representing data flow or interactions between them.
- They’re useful for understanding system boundaries and dependencies.
Importance of Context Diagrams in Systems Analysis
- Scope Definition: Context diagrams define the system’s boundaries by highlighting its interactions with external entities, ensuring that the analysis focuses on pertinent components and processes.
- Requirement Gathering: These diagrams visualize how the system interacts with its environment, aiding in identifying both functional and non-functional requirements. They offer clarity on the system’s objectives and its external interactions.
- Communication: Acting as a bridge between stakeholders, such as business users, developers, and project managers, context diagrams foster shared understanding of the system’s scope and context. They streamline discussions and decision-making throughout the development process.
- Risk Identification: Context diagrams assist in spotting potential risks stemming from the system’s interactions with external entities. They help stakeholders assess the implications of external factors on the system’s performance, security, and reliability.
Components of Context Diagrams
1. System/Product:
This is the primary focus of the diagram, representing the system being analyzed or designed.

2. External Entities
These are entities outside the system boundary that interact with the system. They could be users, other systems, or processes that provide input to or receive output from the system.
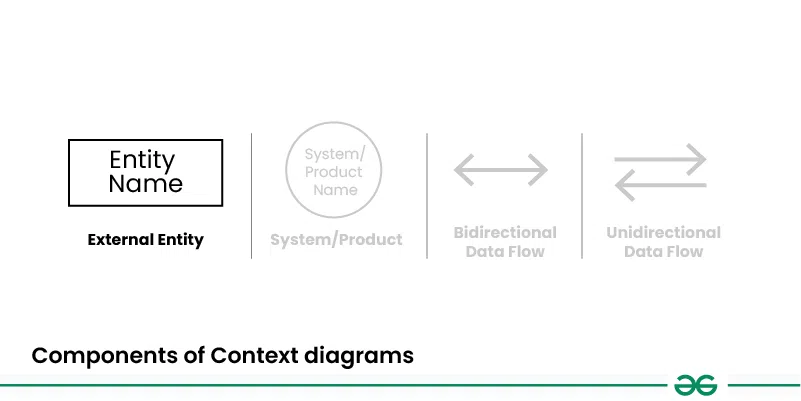
3. Data Flow
These are arrows representing the flow of data or information between the system and external entities. They illustrate the exchange of data between the system and its environment.
1. Unidirectional Data Flow
Unidirectional data flow indicates that data moves in only one direction between two components. For example, data flows from an external entity to a process, or from a process to a data store, but not in the opposite direction. This type of data flow is represented by a single arrow indicating the direction of data movement.

2. Bidirectional Data Flow
Bidirectional data flow indicates that data can move in both directions between two components. For example, data flows between a process and an external entity can be bidirectional, allowing the process to send data to the external entity and receive data back. This type of data flow is represented by a double-headed arrow indicating that data can move in both directions.

Different Types of Relationships and Interactions in Context Diagrams
Below are the different types of relationships and interactions in Context Diagram:
- Input/Output Relationships:
- Input: Data or information flowing into the system from external entities.
- Output: Data or information flowing out of the system to external entities.
- Control Relationships:
- Control: External entities influencing or directing the system’s behavior or processes.
- Controlled by: The system may be subject to control or influence by external entities.
- Mechanism Relationships:
- Mechanism: Describes how the system operates or responds to external stimuli or events.
- Trigger: External events prompting the system to execute specific actions or behaviors.
Steps to create a Context Diagram
Below are the steps of how to draw Context Diagram:
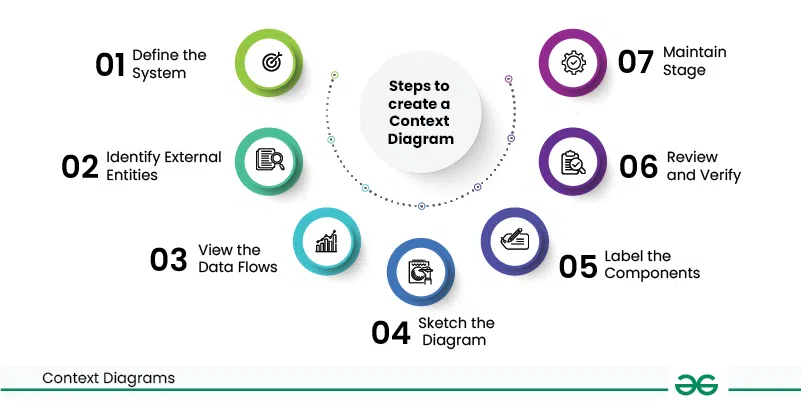
- Step1: Define the System: Start by clearly defining the system you’re analyzing or designing, outlining its boundaries and objectives.
- Step2: Identify External Entities: Recognize all external entities that interact with the system, including users, other systems, or processes that exchange data with it.
- Step3: View the Data Flows: Determine how data flows between the system and external entities, specifying the types of data and their direction (input or output).
- Step4: Sketch the Diagram: Utilize standardized symbols and notation to create the context diagram. Position the system at the center and surround it with external entities, using arrows to depict data flow.
- Step5: Label the Components: Ensure each element of the diagram is clearly labeled, including the system, external entities, and data flows, providing concise descriptions for clarity.
- Step6: Review and Verify: Collaborate with stakeholders to review the context diagram, confirming its accuracy and completeness in representing the system’s interactions.
- Step7: Maintain Stage: Regularly update the diagram to reflect changes in the system or its external environment, ensuring it remains an accurate depiction of the system’s context.
Benefits of using Context Diagram
Below are the benefits of using Context Diagram:
- Clarity: Context diagrams offer a straightforward and clear snapshot of how the system interacts with its surroundings, aiding stakeholders in grasping its scope and context with ease.
- Communication: Serving as effective communication aids, these diagrams streamline discussions and decision-making among stakeholders, fostering collaboration between business users, developers, and project managers.
- Scope Definition: By delineating the system’s boundaries and external entities, context diagrams assist in defining the project’s scope, ensuring that efforts are focused on pertinent components and processes.
- Dependency Management: Understanding the system’s relationships with external entities facilitates the management of dependencies, empowering stakeholders to anticipate and prepare for potential impacts of external changes.
- Risk Identification: Context diagrams help pinpoint potential risks stemming from the system’s interactions with external elements, empowering stakeholders to identify, assess, and mitigate risks effectively.
Challenges of using Context Diagram
Below are the challenges of using Context Diagram:
- Scope Creep: Maintaining focus on relevant external entities and interactions can be challenging amidst attempts to expand the diagram’s scope beyond necessity.
- Complexity Management: Diagrams for intricate systems may become convoluted, making it difficult to sustain simplicity and clarity.
- Accuracy: Ensuring the diagram faithfully represents the system’s interactions demands rigorous analysis and validation, which can consume significant time and resources.
- Dependency Identification: Understanding dynamic dependencies between the system and external entities poses a challenge, especially in environments where dependencies frequently change.
- Consensus Building: Reaching agreement among stakeholders on the diagram’s content and representation proves challenging, particularly when differing perspectives and priorities come into play.
- Maintenance: Keeping diagrams current as systems evolve and external factors shift demands ongoing effort and coordination among stakeholders.
Real-World Example of Context Diagrams
Let’s understand Context Diagram using an example of Library Management System.
- Student Database: A system or a collection of data related to students, which can include information such as names, IDs, and academic records.
- Students info: Requesting or providing information related to students.
- Staff: People employed by an organization, often having a specific role or responsibility.
- Library management system: A system used to manage and organize library resources, such as books, periodicals, and multimedia materials.
- Stock: Inventory or resources available in a system.
- Supplier: An entity that provides goods or services to another entity.
- Book details: Information related to books, such as titles, authors, and publication dates.
- Availability: The state of being accessible or usable. In the context, it likely refers to the availability of books or other resources.
- Management: The process of coordinating and controlling resources to achieve specific goals.
A context diagram for this information would include the following elements:
- External entities: Students, Staff, Supplier
- Processes: Requesting information (Students info, Book details, Availability), Managing resources (Library management system, Stock, Student Database)
- Data stores: Student Database, Library management system, Book Database.

Use-Cases of Context Diagram
Below are the Use-Cases of Context Diagram:
- Business Operations Analysis: Within business operations, such as supply chain management or customer relationship management, context diagrams elucidate the interplay between departments, systems, and external entities like vendors or clients.
- Software Engineering and Development: In software creation, context diagrams provide a foundational understanding during the initial design phase by delineating how the system interacts with users, external systems, and data sources. This clarity guides developers in meeting system requirements.
- IT Infrastructure Planning: Professionals engaged in IT infrastructure planning leverage context diagrams to gain insight into network components’ interactions, such as servers, routers, and end-users, within the network architecture.
- Project Management: Context diagrams serve as valuable communication tools in project management, aiding in articulating project scope and dependencies to stakeholders, ensuring alignment with project objectives.
- Supply Chain Optimization: Context diagrams are instrumental in supply chain management, enabling the mapping of supply chain processes and fostering a deeper understanding of interactions among suppliers, manufacturers, distributors, and retailers, thereby optimizing logistical operations.
Share your thoughts in the comments
Please Login to comment...