Class Interval in Statistics is an important element, particularly in organizing and summarizing data. It serves as a fundamental tool for grouping data points into meaningful categories, enabling a more manageable and insightful analysis. In this comprehensive article, we will delve into the concept of class intervals in statistics, their significance, and how to effectively create and utilize them.
Our exploration begins with a clear definition of class intervals and their role in statistical analysis. We will discuss the importance of choosing appropriate class intervals to reveal patterns, trends, and distributions within datasets. Whether you’re a student embarking on a statistics course or a data analyst seeking to enhance your data interpretation skills, this article is your guide to mastering class intervals.
What Is Class Interval?
In statistics, a “class interval” is a range of values into which data is grouped for the purpose of organizing, summarizing, and analyzing data efficiently. It is particularly useful when dealing with continuous data, where individual data points can vary continuously over a range. By creating class intervals, you can simplify the presentation of data and identify patterns and trends more easily.
A class interval is defined by two values:
- Lower Class Limit: This is the smallest value that can belong to a class interval. It is inclusive, meaning it is part of the interval.
- Upper Class Limit: This is the largest value that can belong to a class interval. It is exclusive, meaning it is not part of the interval immediately following it.
Class Interval Example
Example: Using the class intervals [20, 30), [30, 40), [40, 50), and [50, 60), calculate the frequency of data points in each interval?
Data: 25, 32, 38, 45, 55, 22, 31, 52, 28, 43
Solution:
Class Intervals and calculating their frequencies:
- [20, 30): 25, 22, 28 (Frequency = 3)
- [30, 40): 32, 31 (Frequency = 2)
- [40, 50): 38, 45, 43 (Frequency = 3)
- [50, 60): 55, 52 (Frequency = 2)
These frequencies represent how many data points fall within each class interval.
Purpose of Class Interval
The purpose of class intervals in statistics and data analysis is to organize and summarize large sets of data effectively. Class Intervals play a vital role in data analysis and statistics by organizing, summarizing, and enhancing the understanding of data. They are a foundational tool for researchers, analysts, and decision-makers in various fields, enabling them to extract valuable insights from data and make data-driven decisions.
Class intervals are like the chapters in a book. Instead of reading every single word, you read sections to understand the story better. Similarly, class intervals help us “read” data more efficiently.
The formula to calculate the class interval in statistics is given for grouped and ungrouped data. The formulas for the two cases are given below:
Class Interval Formula for Grouped Data
Class Interval = Upper Limit – Lower Limit
Class Interval Formula for Ungrouped Data
Class Interval = (Range of Data) / (Number of Class Intervals)
The terminologies used in the formula is discussed below:
- Class Width: This is what you’re trying to calculate, the size or width of each class interval.
- Range of Data: The range of data refers to the difference between the maximum and minimum values in your dataset. You can calculate it using the formula:
- Range = Maximum Value – Minimum Value
- Number of Class Intervals: This is the number of intervals or bins you want to create to group your data effectively. It depends on your data and the level of detail you want in your frequency distribution.
How to find a Class Interval?
To find a suitable class interval for your data, follow these steps:
- Determine the Range: Calculate the range of your dataset by subtracting the minimum value from the maximum value.
- Choose the Number of Class Intervals: Decide how many intervals you want to create. This choice depends on the size of your dataset and your analysis objectives. A common rule is to use between 5 and 20 intervals.
- Calculate the Class Width: Divide the range by the number of intervals you’ve chosen to determine the class width. The formula is:
- Class Width = (Range of Data) / (Number of Class Intervals)
- Set the Boundaries: Start with the minimum value and add the class width successively to set the lower and upper boundaries of each interval.
- Organize Data: Group your data points into the appropriate intervals based on the boundaries you’ve defined.
Adjust these steps based on the specific characteristics of your dataset and your analysis goals to find a class interval that effectively represents your data.
Types of Class Interval
In statistics, can be categorized into two various types based on how they are structured and what kind of data they are used to represent i.e.,
- Exclusive Class Interval
- Inclusive Class Interval
Let’s discuss these types in detail.
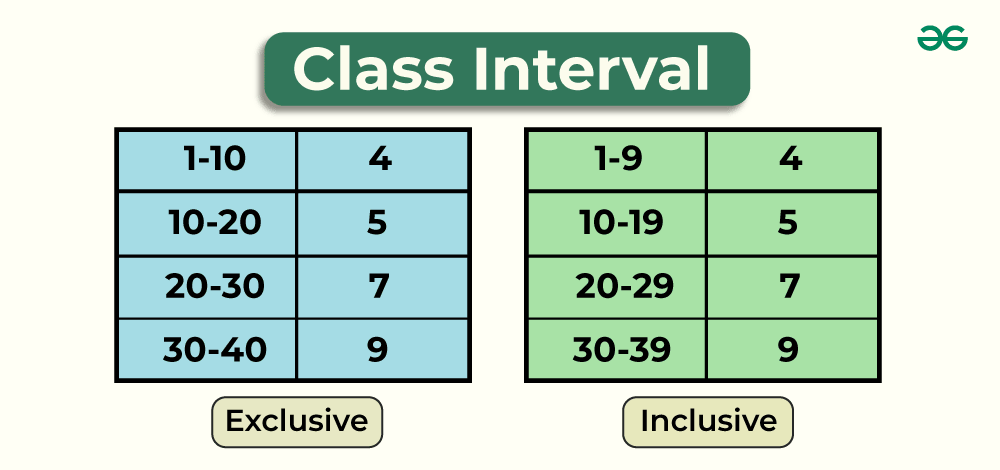
Exclusive Class Interval
In exclusive class intervals, the lower bound (minimum value) is included in the interval, while the upper bound (maximum value) is excluded. This means that data points equal to the upper bound are assigned to the previous interval. Exclusive intervals are commonly used when precision and differentiation between values are essential.
- In this type of class interval, the lower bound is included in the interval, while the upper bound is excluded.
- For example, consider the interval [10, 20). This interval includes all values from 10 up to, but not including, 20. So, it encompasses values like 10, 11, 12, …, 18, and 19.99, but not 20 itself.
- In Exclusive Class Interval the next class interval’s lower limit is equal to the upper limit of previous class interval.
| 0 – 10 |
12 |
| 10 – 20 |
14 |
| 20 – 30 |
16 |
| 30 – 40 |
11 |
| 40 – 50 |
9 |
Inclusive Class Interval
In inclusive class intervals, both the lower bound and the upper bound are included within the interval. This type of interval is used when you want to ensure that data points equal to the bounds are part of the interval. Inclusive intervals are often used when you want to emphasize that both endpoints are part of the same category.
- Both the lower and upper bounds are included in the interval.
- For example, consider the interval [10, 20]. This interval includes all values from 10 to 20, including 10, 11, 12, …, 19, and 20.
- In inclusive Interval, the upper limit of the class is different from the lower limit of the next class.
| 10 – 19 |
12 |
| 20 – 29 |
14 |
| 30 – 39 |
16 |
| 40 – 49 |
11 |
| 50 – 59 |
9 |
The choice between exclusive and inclusive intervals depends on the specific context of your analysis and the level of detail you want to convey. Both types have their uses in statistics, and your choice should align with your objectives for data grouping and presentation.
How to Convert Inclusive Class Interval to Exclusive Class Interval?
In class 9, we have to solve questions in Exclusive Class Interval, hence we need to convert the inclusive Class Interval into exclusive class interval.
To convert Inclusive Class Interval to Exclusive Class Interval we need to find the average of the gap between the upper and lower limit of two successive classes and then subtract the average from the lower limit of each class and add the average to the upper limit of each class. Let’s understand it with an example.
Consider an Inclusive Class Interval given below:
| 10 – 19 |
12 |
| 20 – 29 |
14 |
| 30 – 39 |
16 |
| 40 – 49 |
11 |
| 50 – 59 |
9 |
Now to convert this inclusive class interval into exclusive we will find the average of the gap between the upper and lower limit of two successive classes i.e. (10 – 9)/2 = 0.5
Now subtract this 0.5 from the lower limit of each class and add 0.5 to the upper limit of each class. Hence, the exclusive class interval obtained is mentioned below:
| 9.5 – 19.5 |
12 |
| 19.5 – 29.5 |
14 |
| 29.5 – 39.5 |
16 |
| 39.5 – 49.5 |
11 |
| 49.5 – 59.5 |
9 |
Importance of Class Interval
Class Interval is a fundamental concept in statistics that are used to classify data for easy visualization and calculation. Following are some advantages of Class Interval
- Simplify Complex Data: Class intervals simplify large data sets by reducing the number of data points, and classifying them into groups
- Easy Data Visualization: Class intervals are important in creating various data visualizations like histograms, frequency polygons, and bar charts, which provide a clear overview of data distribution.
- Statistical Analysis: They provide statistical analysis by grouping data into meaningful categories, that allows to calculate central tendency and measures of dispersion.
- Easy Communication: When data is presented in Class Interval form rather that dispersed form it becomes easy to convey the message.
Also, Check
Solved Examples On Class Interval
Example 1: Create a frequency distribution using class intervals for the age of sample population
Here’s the data: 15, 18, 22, 28, 35, 42, 50, 52, 60, 65
Solution:
Let’s create a frequency distribution with class intervals:
Step 1: Creating Class Intervals:
To analyze this data effectively, let’s create class intervals to group the age. We’ll choose class intervals of width 10, starting from the lowest age.
Step 2: Determine the Range:
Range = Maximum Age – Minimum Age
Range = 65 – 15 = 50
Step 3: Choose the Number of Intervals:
Let’s choose 5 intervals for this example.
Step 4: Calculate the Interval Width:
The interval width is calculated by dividing the range by the number of intervals
Interval Width = Range / Number of Intervals
Interval Width = 50 / 5 = 10
Step 5: Set Up the Intervals
Now, we’ll create the class intervals based on the interval width:
- Class Interval 1: [15-25)
- Class Interval 2: [25-35)
- Class Interval 3: [35-45)
- Class Interval 4: [45-55)
- Class Interval 5: [55-65)
| [15-25) |
3 |
| [25-35) |
2 |
| [35-45) |
1 |
| [45-55) |
2 |
| [55, 65) |
2 |
Now, the data has been organized into class intervals, and we have the frequency of data points within each interval.This distribution helps us see how many students fall into each age group, making it easier to analyze and summarize the data.
Example 2: Arrange the dataset of exam scores for a class of students in class interval
72, 85, 62, 91, 78, 54, 88, 96, 70, 68, 75, 82, 59, 93, 77, 64, 80, 87, 73, 89, 66, 71, 84, 92, 76, 61, 79, 86, 67, 90
Solution:
Steps involved in grouping score into class interval:
Step 1: Creating Class Intervals:
To analyze this data effectively, let’s create class intervals to group the scores. We’ll choose class intervals of width 10, starting from the lowest score.
Step 2: Determine the Range: The range of the data is the difference between the highest and lowest scores:
Range = Maximum Score – Minimum Score
Range = 96 – 54
Range = 42
Step 3: Choose the Number of Class Intervals: For this example, let’s use five class intervals to provide a reasonable level of detail:
- 50-59
- 60-69
- 70-79
- 80-89
- 90-99
Step 4: Calculate the Class Width: To determine the width of each class interval, divide the range by the number of intervals:
Class Width = Range / Number of Intervals
Class Width = 42 / 5
Class Width ≈ 8.4
Since class intervals should be meaningful whole numbers, let’s round up the class width to 9.
Step 5: Set the Boundaries: Now, set the lower and upper boundaries for each class interval:
- 50-59 (Lower Limit: 50, Upper Limit: 59)
- 60-69 (Lower Limit: 60, Upper Limit: 69)
- 70-79 (Lower Limit: 70, Upper Limit: 79)
- 80-89 (Lower Limit: 80, Upper Limit: 89)
- 90-99 (Lower Limit: 90, Upper Limit: 99)
Organize Data into Class Intervals: Group the exam scores into the appropriate class intervals based on the boundaries. For example, a score of 72 falls into the 70-79 class interval.
Example 3: Given the following data points, create class intervals with a width of 10
Data: 12, 18, 25, 30, 35, 42, 48, 55, 60, 65, 70
Solution:
1.Calculate the range:
Range = Maximum value – Minimum value
= 70 – 12 = 58.
2.Decide on the number of intervals (let’s say 5).
3.Calculate the interval width:
Width = Range / Number of intervals = 58 / 5 = 11.6 (round up to 12).
4.Set up the intervals:
- [10, 22)
- [22, 34)
- [34, 46)
- [46, 58)
- [58, 70)
This creates five class intervals to represent the data effectively.
Practice Problems on Class Interval
Q1. You have a dataset of monthly incomes for a group of individuals. The incomes range from 1,200 Rupees to 5,800 Rupees. Create class intervals for this dataset, choosing an appropriate number of intervals and class width?
Q2. Given a dataset of test scores for a class of students, ranging from 45 to 98, decide whether to use exclusive or inclusive class intervals. Create class intervals with an appropriate number of intervals and class width?
Q3. You’re analyzing the ages of customers in a retail store. The ages range from 20 to 80. Determine the number of class intervals you should use, calculate the class width, and set the boundaries for each interval?
Q4. A dataset contains the heights (in inches) of a group of basketball players. Heights range from 68 to 84 inches. Create class intervals for this dataset and organize the heights into these intervals?
Q5. Given below is the time taken in min by employees to reach their office
5, 7, 8, 10, 15, 22, 25, 28, 30, 35, 38, 42, 45, 47, 49, 51, 54, 56, 58, 60
Determine an appropriate number of class intervals and class width for this dataset, and present the frequency distribution?
FAQs on Class Interval
1. What is a Class Interval in Statistics?
A class interval in statistics is a range of values used to group data points for easy vizualization and analysis.
2. What is the Modal Class Interval?
The modal class interval is the class interval within a frequency distribution that contains the mode, which is the value or values that occur with the highest frequency. It represents the most common range of values in a dataset.
3. How do you Calculate the Class Interval?
To calculate the class interval, follow these steps:
Step 1: Determine the range of your data (the difference between the maximum and minimum values).
Step 2: Decide on the number of class intervals you want.
Step 3: Divide the range by the number of intervals to find the class width.
Step 4: Set the boundaries for each interval based on the class width.
Step 5: Organize data points into the appropriate intervals.
4. What is the Size of the Class Interval?
The size of the class interval, also called class width, is the range covered by each interval when grouping data for analysis. It depends on factors like the data’s range, distribution, and your analysis goals. Choosing the right size balances detail and simplicity in data presentation.
5. What’s the ideal Number of Class Intervals to use?
There is no single solution to this question. The number of intervals should be chosen based on the nature of the data and the objectives of analysis. Common methods like the Sturges’ rule or square root rule can help determine an appropriate number.
6. What factors should I consider when determining the size of the Class Interval?
When determining the size (width) of the class interval, you should consider the range of your data, the number of data points, and your analysis goals.
Share your thoughts in the comments
Please Login to comment...