Blood Pressure Analysis GUI Using Gradio in Python
Last Updated :
30 Dec, 2022
This article will teach you to create a basic GUI using Gradio to analyze blood pressure in Python.
Gradio is an open-source library that helps coders effortlessly create User Interface(UI) components for functions with minimal lines of code.
Based on the systole and diastole values of a patient’s blood pressure in mmHg, the task is to analyze whether the patient has normal blood pressure, elevated blood pressure, and so on.
Understanding the Problem
Two parameters have to be provided to the bp function that checks for the normalcy of blood pressure values. The parameters are:
- systole is the blood pressure reading measured when the heart beats
- diastole is the blood pressure reading measured when the heart rests between the beats.
For convenience in the analysis, we assume that the above parameters are entered in mmHg units.
Now, based on the parameters, the following conclusions are reached by the function:
- If systole is less than 120 mmHg and diastole is less than 80 mmHg then the message given below is returned :
“Normal Blood Pressure”
- If systole lies in the range of 120-129 mmHg and diastole is less than 80 mmHg then the following message is returned:
“Elevated Blood Pressure”
- If systole lies in the range of 130-139 mmHg or if diastole falls between 80-89 mmHg range then the message given below is returned
“First Stage High Blood Pressure”
- If none of the conditions is satisfied then the following message is returned:
“Second Stage High Blood Pressure”
Install the required Packages
First and foremost we need to add the gradio package to our system. To install the gradio run the following command in the terminal:
pip install gradio
Algorithm
In order to analyze the systole and diastole values of the patient’s blood pressure, the steps given below are followed:
- Import Gradio as gr
- Create a function called bp that accepts systole and diastole values as parameters
- Within the bp function, follow the interpretation of inputs given above by creating an if-elif ladder and return the messages accordingly.
- Create Gradio Interface stored into the ‘interface’ variable and specify the input and output types.
- Launch the interface to obtain the “Analysis of Blood Pressure” UI using the interface.launch() method.
Following is an implementation of the algorithm stated above:
Python
import gradio as gr
def bp(systole,diastole):
if((systole<120) and (diastole<80)):
return ("Normal Blood Pressure")
elif ((systole>=120 and systole<130)
and (diastole<80)):
return ("Elevated Blood Pressure")
elif ((systole>=130 and systole<140)
or (diastole>=80 and diastole<=89)):
return ("First Stage High Blood Pressure")
else:
return ("Second Stage High Blood Pressure")
interface=gr.Interface(fn=bp,inputs=["number","number"],
outputs=['text'],title="ANALYSIS OF BLOOD PRESSURE")
interface.launch()
|
Output:
When the interpreter runs the interface.launch() command it prints out the following as output:
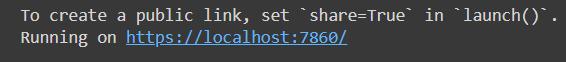
Gradio interface.launch() output
On clicking this link, the interface is displayed and the inputs are provided accordingly:
.gif)
Resulting Gradio GUI
Share your thoughts in the comments
Please Login to comment...