Adding Text to Plots in R programming – text() and mtext () Function
Last Updated :
24 Nov, 2023
Text is defined as a way to describe data related to graphical representation. They work as labels to any pictorial or graphical representation. In this article, we will learn to add a text to a plot in R Programming Language by using the text() and mtext() functions.
R – text () Function
text () Function in R Programming Language is used to draw text elements to plots in Base R.
Syntax: text(x, y, labels)
Parameters:
- x and y: numeric values specifying the coordinates of the text to plot
- labels: the text to be written
Returns: Added text to plot
Add text in plot using text function
R
d<-head(mtcars)
plot(d[, 'wt'], d[, 'mpg'],
main = " Car Weight vs. Milage ",
xlab = "Miles", ylab = " Weight",
pch = 19, col = "darkgreen")
text(d[, 'wt'], d[, 'mpg'], row.names(d),
cex = 0.88, pos = 2, col = "darkgreen")
|
Output:
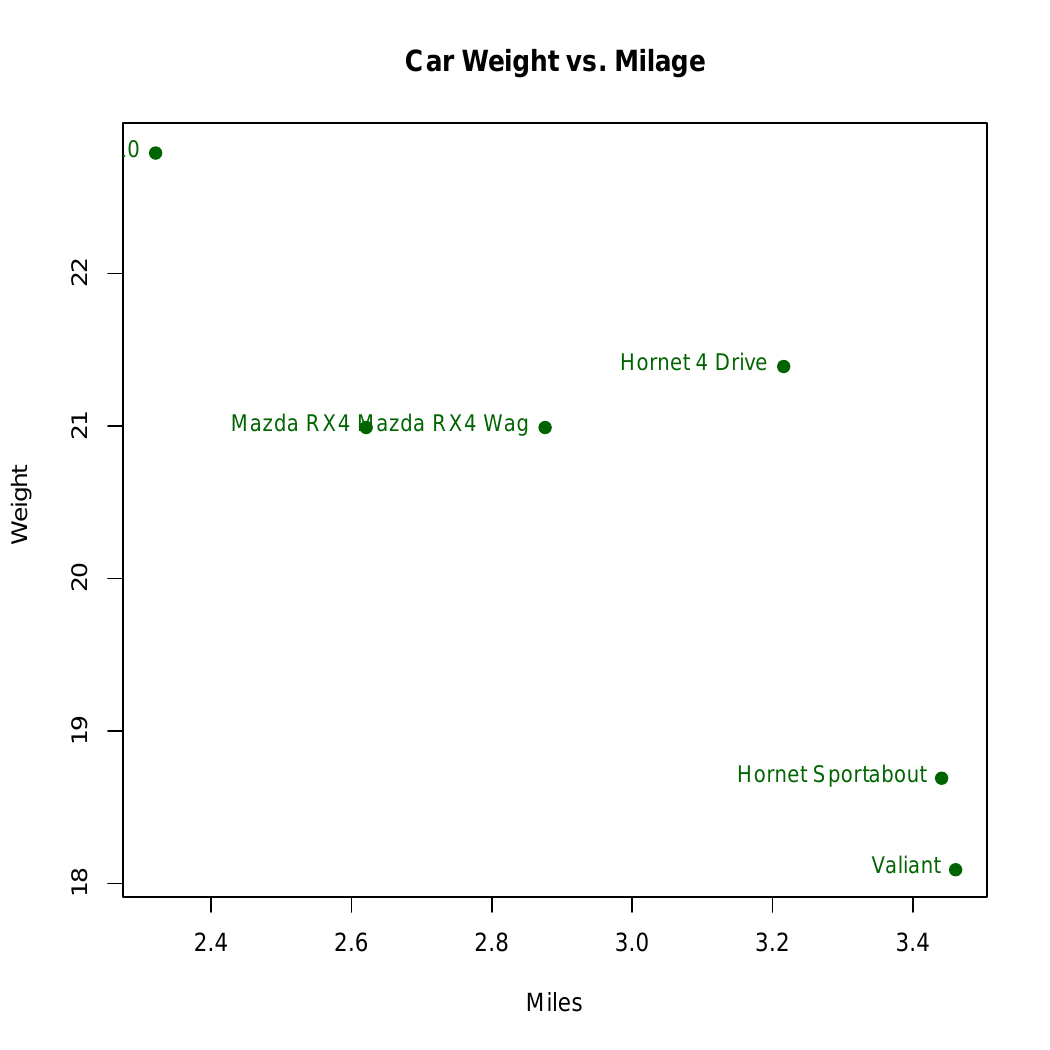
In the above example, the text is added to the plot of ‘mtcar’ dataset.
Implementation of text() to add a mathematical annotation to a plot
R
plot(1:5, 1:5,
main = "text() Function examples")
text(2, 3, expression(hat(beta) == (X^t * X)^{-1} * X^t * y))
text(3, 4, expression(bar(x) == sum(frac(x[i], n), i==1, n)))
|
Output:
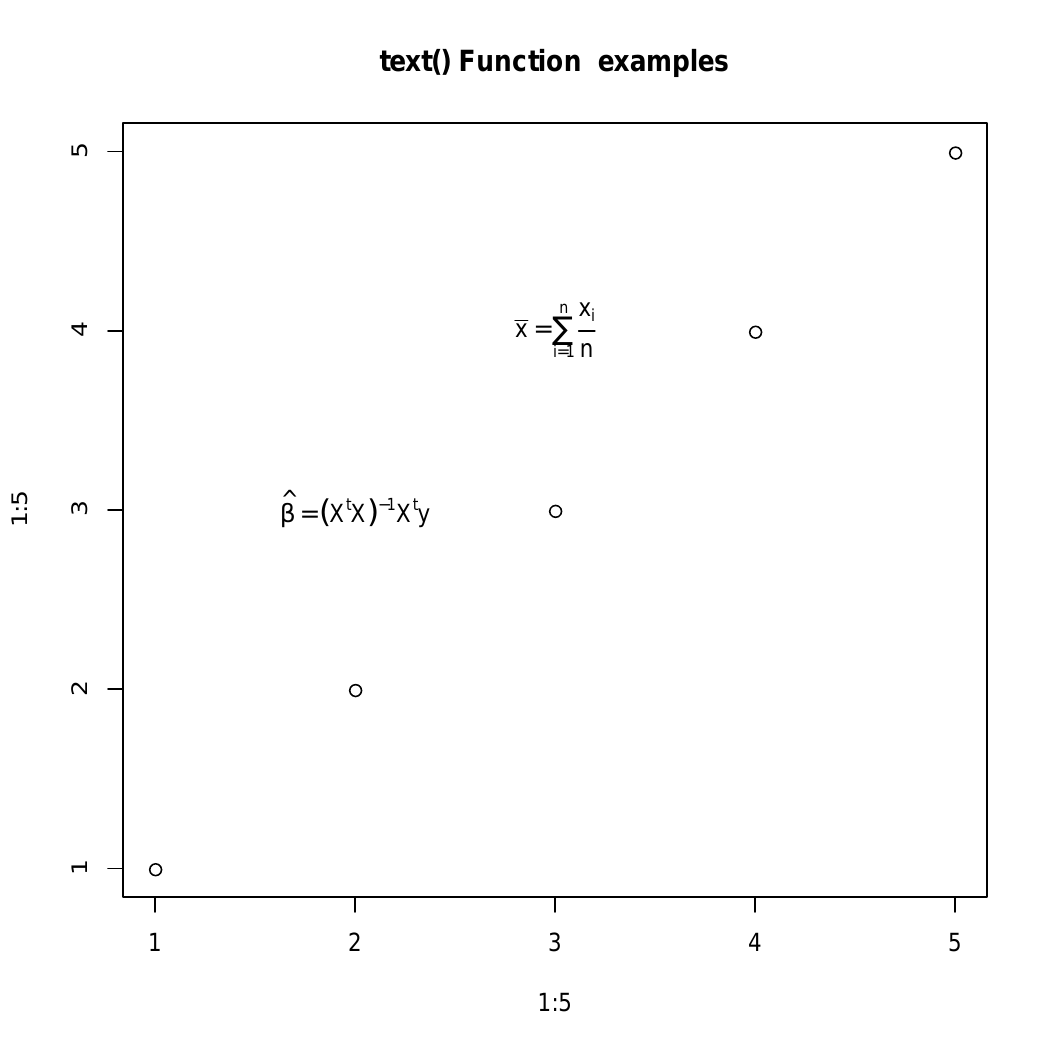 In the above example, the text() function is used to add a mathematical annotation to a plot.
R – mtext () Function to Add text to the margins of the graph
mtext() function in R Programming Language is used to add text to the margins of the plot.
Syntax: mtext(text, side)
Parameters:
- text: text to be written
- side: An integer specifying the side of the plot, such as: bottom, left, top, and right.
Returns: Added text in the margins of the graph
Adding Text to Multiple Margins using mtext()
R
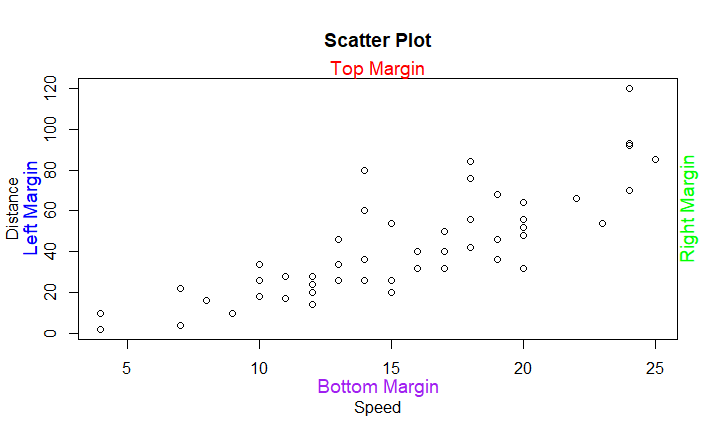
plot(cars$speed, cars$dist, main = "Scatter Plot", xlab = "Speed", ylab = "Distance")
mtext("Left Margin", side = 2, line = 2, col = "blue", cex = 1.2)
mtext("Right Margin", side = 4, line = 0, col = "green", cex = 1.2)
mtext("Top Margin", side = 3, line = 0, col = "red", cex = 1.2)
mtext("Bottom Margin", side = 1, line = 2, col = "purple", cex = 1.2)
|
Output:
Adding Text to Plots in R programming – text() and mtext () Function
First we create a scatter plot using the plot() function with the cars dataset. Text annotations are added to different margins using the mtext() function: “Left Margin” in blue on the left, “Right Margin” in green on the right, “Top Margin” in red at the top, and “Bottom Margin” in purple at the bottom. The parameters such as side determine the location, line controls the position, col sets the color, and cex adjusts the text size.
Share your thoughts in the comments
Please Login to comment...