Adding a Dendrogram to a ggplot2 Heatmap in R
Last Updated :
16 Oct, 2023
A potent technique that improves the visualisation of hierarchical clustering patterns inside data is to add a dendrogram to a ggplot2 heatmap in R. Dendrograms shed light on the connections and resemblances among data points, assisting in the discovery of distinct clusters or groups. We will examine how to combine dendrograms with ggplot2 heatmaps using R in this article, enabling a more thorough comprehension of intricate data structures and patterns.
Heatmap
A heatmap is a graphical representation of data in which each value is represented by a different colour. It’s very helpful for analysing complicated data sets and spotting trends or correlations between variables. Large datasets may be interpreted and analysed more easily because each cell in the heatmap represents a data point and is coloured according to its value.
Dendrogram
A dendrogram is a tree-like diagram used in hierarchical clustering to represent the arrangement of data points based on their similarity or dissimilarity. Dendrograms are often displayed alongside heatmaps to help visualize how data points cluster together.
Applications of Dendrograms:
Genetics: Dendrograms are widely used in genetics to analyze DNA sequences and determine evolutionary relationships between species or individuals.
Market Segmentation: In marketing, dendrograms can be used to group customers or products based on similarities in their purchasing behavior or characteristics.
Phylogenetics: Biologists use dendrograms to construct evolutionary trees and understand the evolutionary history of species.
The hierarchical clustering of the data may be learned a lot by adding a dendrogram to a R ggplot2 heatmap. The ggtree package, which enables the addition of dendrograms to ggplot2 displays, can be used to accomplish this. A step-by-step tutorial for adding a dendrogram to a ggplot2 heatmap is provided below:
Hierarchical Clustering: Hierarchical clustering is a method that organizes data points into a hierarchical tree-like structure called a dendrogram. It is commonly used to group similar observations together based on their similarity or dissimilarity.
ggplot2: ggplot2 is a popular R package for data visualization. It allows for the creation of a wide range of customizable graphics and plots, making it a versatile choice for adding dendrograms to heatmaps.
Using heatmap Function:
R
data <- matrix(runif(25), nrow=5)
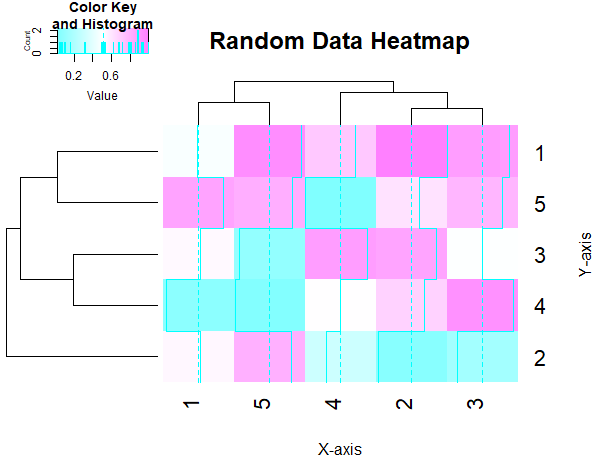
heatmap(data, col=cm.colors(256), main="Random Data Heatmap",
xlab="X-axis", ylab="Y-axis")
|
Output:

Adding a Dendrogram to a ggplot2 Heatmap in R
In this example, we first generate random data using matrix and runif. Then, we create a heatmap using the heatmap function, specifying the color palette with col and adding labels and a title.
Using heatmap.2 Function from the gplots Package:
R
library(gplots)
data <- matrix(runif(25), nrow=5)
heatmap.2(data, col=cm.colors(256), main="Random Data Heatmap",
xlab="X-axis", ylab="Y-axis")
|
Output:
Adding a Dendrogram to a ggplot2 Heatmap in R
In this example, we load the gplots package, generate random data, and create a heatmap using the more flexible heatmap.2 function. Like the previous example, we specify the color palette with col and add labels and a title.
Using Dendextend Library
R
install.packages("gplots")
library(gplots)
library(dendextend)
set.seed(123)
data_matrix <- matrix(rnorm(100), nrow = 10)
rownames(data_matrix) <- paste("Row", 1:10)
colnames(data_matrix) <- paste("Col", 1:10)
row_dendro <- as.dendrogram(hclust(dist(data_matrix)))
col_dendro <- as.dendrogram(hclust(dist(t(data_matrix))))
heatmap_plot <- heatmap.2(data_matrix,
dendrogram = "row",
Colv = col_dendro,
trace = "none",
col = colorRampPalette(c("blue", "white", "red"))(50),
scale = "none",
key = TRUE,
keysize = 1.0,
key.title = NA)
print(heatmap_plot)
|
Output:

Adding a Dendrogram to a ggplot2 Heatmap in R
- We use the heatmap.2() function from the gplots package to create the heatmap.
- We specify dendrogram = “row” to add a row dendrogram.
- Colv = col_dendro specifies the column dendrogram.
- trace = “none” removes the trace lines.
- col specifies the color palette for the heatmap.
- scale = “none” prevents scaling of the data.
- key = TRUE adds a color key.
- keysize = 1.0 sets the size of the color key.
- key.title = NA removes the color key title.
Adding a Dendrogram to a Heatmap in R using heatmaply
R
library(heatmaply)
set.seed(123)
data_matrix <- matrix(rnorm(100), nrow = 10)
colnames(data_matrix) <- letters[1:10]
rownames(data_matrix) <- letters[11:20]
hc_rows <- hclust(dist(data_matrix))
hc_cols <- hclust(dist(t(data_matrix)))
row_dendro <- as.dendrogram(hc_rows)
col_dendro <- as.dendrogram(hc_cols)
heatmaply(data_matrix, Rowv = row_dendro, Colv = col_dendro)
|
Output:

Adding a Dendrogram to a ggplot2 Heatmap in R
- We generate a sample data matrix (data_matrix) for demonstration purposes. You should replace this with your actual data.
- We perform hierarchical clustering on both the rows and columns of the data matrix using hclust and dist functions. This creates dendrogram objects (row_dendro and col_dendro) that represent the hierarchical structure of the data.
- The main part of the code is the creation of the heatmap with dendrograms using the heatmaply function.
- The heatmaply function generates an interactive heatmap plot. You can explore this plot by clicking and interacting with it. It provides features like zooming, hovering to see data values, and more.
- Remember to replace the sample data (data_matrix) with your actual dataset to visualize your data in the heatmap with dendrograms.
Conclusion
Finally, the addition of dendrograms to R’s ggplot2 heatmaps provides a useful way to find hierarchical clustering patterns in large datasets. Insights into data linkages are provided by dendrograms, which facilitate the recognition of unique clusters or groups. This article has described several approaches for combining dendrograms with ggplot2 heatmaps, including the ggtree package and heatmaply function. Utilising these methods enables data researchers and analysts to efficiently analyse complex data structures and trends, making it a useful tool for a variety of applications, from market segmentation to genetics.
Share your thoughts in the comments
Please Login to comment...