Add Color Between Two Points of Kernel Density Plot in R Programming – Using with() Function
Last Updated :
19 Jun, 2020
plot() and with() functions are used to draw and add color between a particular area of two points of Kernel Density Plot in R Language.
Draw a Kernel Density plot
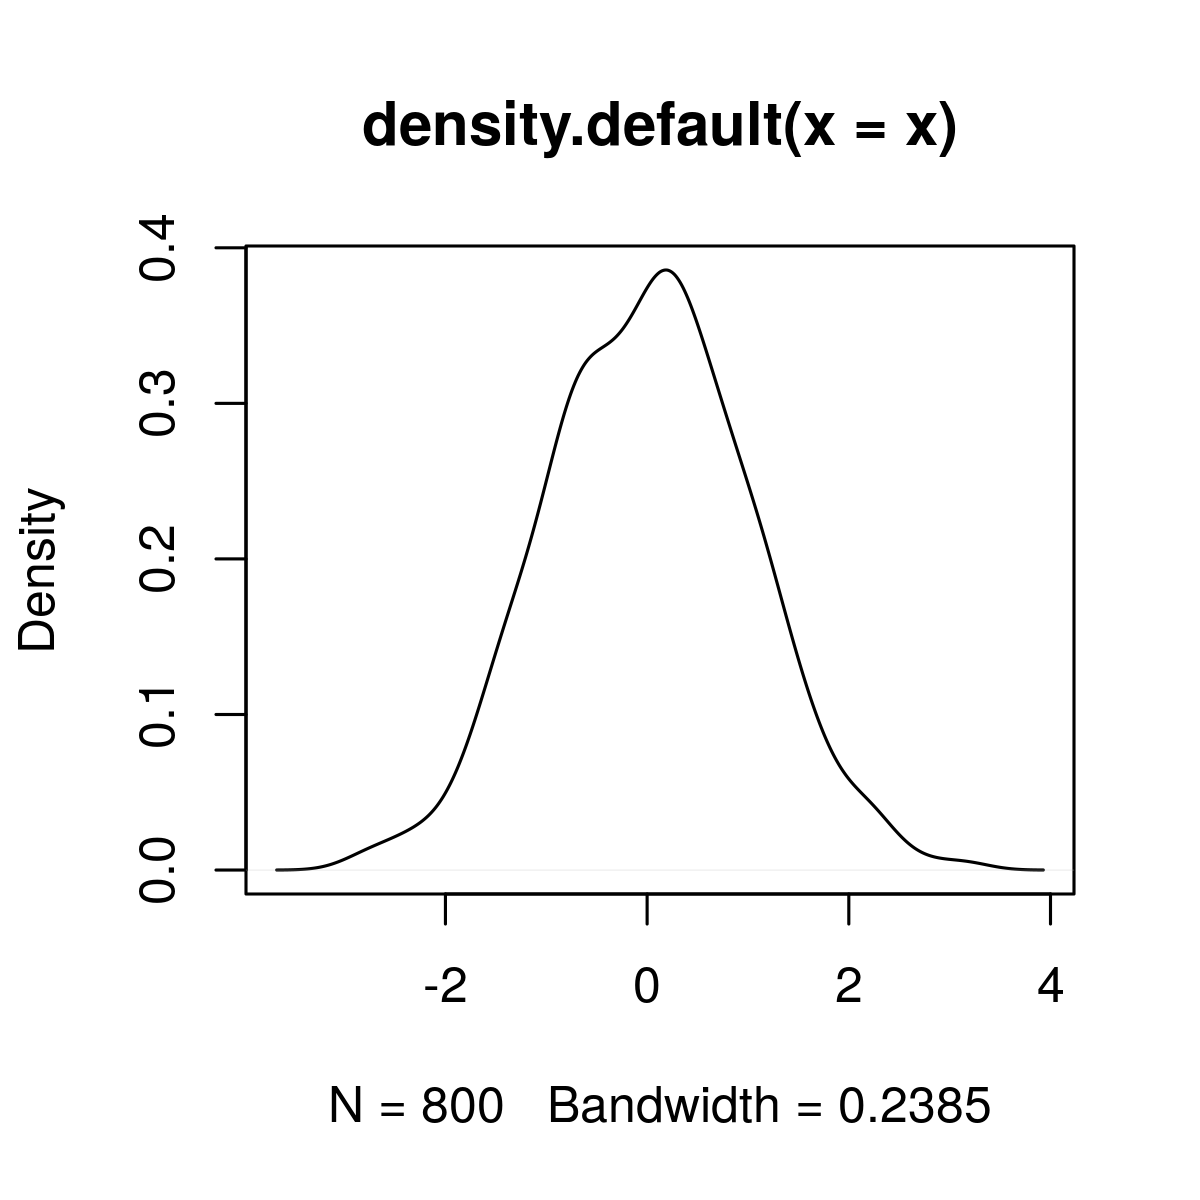
plot() function in R Language is used to draw a Kerner Density Plot
Syntax: plot(dens_x)
Parameters:
dens_x: Default plot of density.
Returns: Kernel density plot
set.seed(72500)
x <- rnorm(800)
dens_x <- density(x)
plot(dens_x)
|
Output:
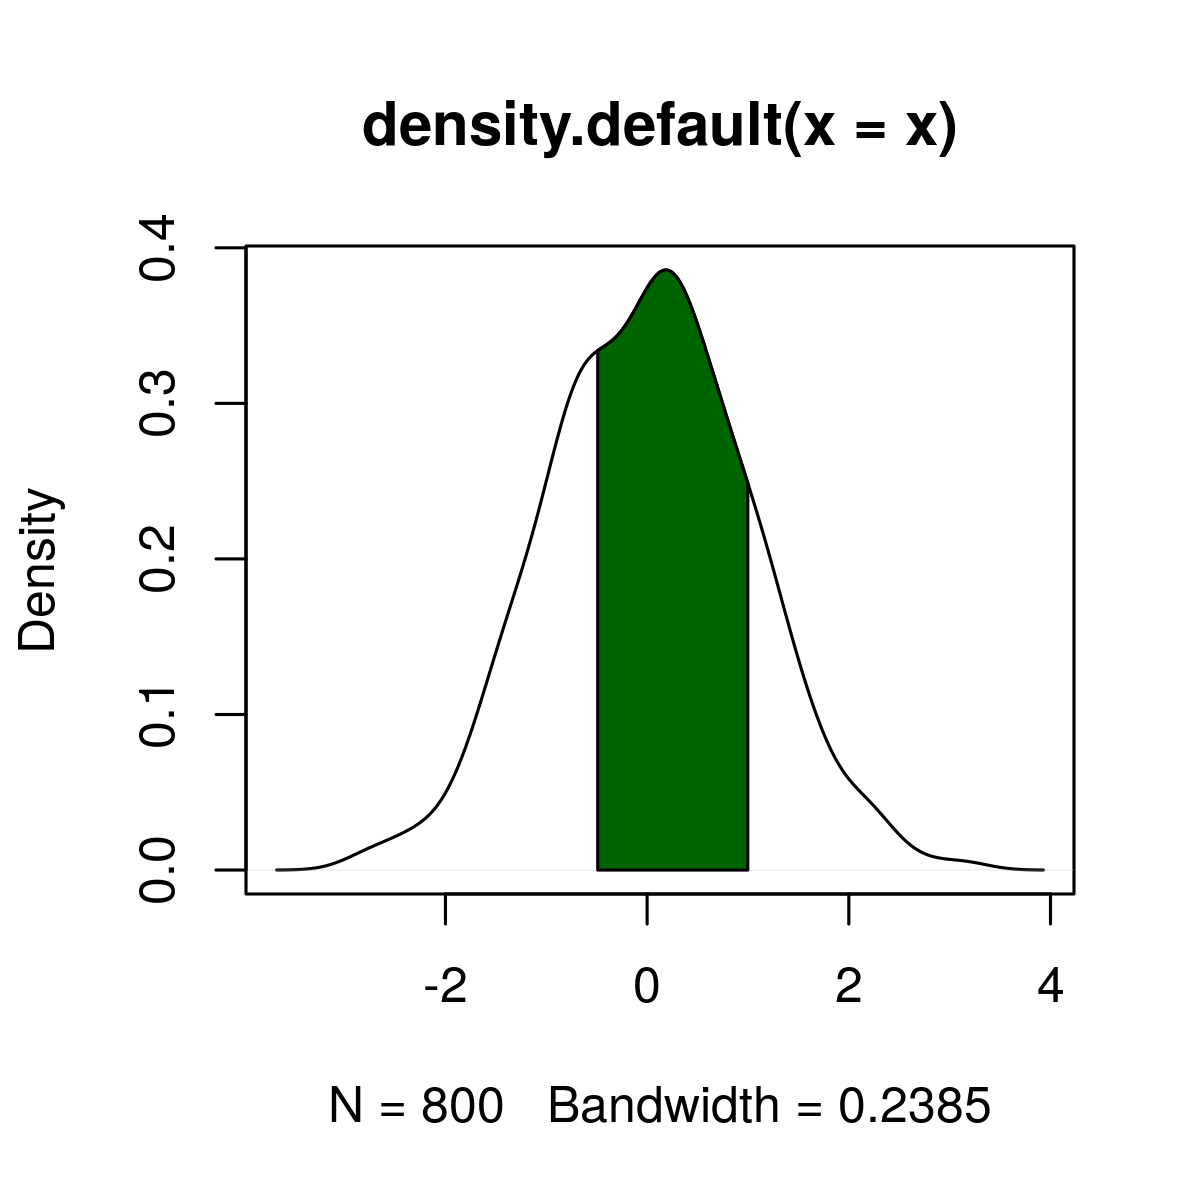
Adding Color to Plot
with() function is used to add color between two points of the graph.
Syntax:
with(dens_x,
polygon(x = c(x),
y = c(0, y[x_low:x_high], 0),
col = ” “))
Parameters:
dens_x: Default plot of density.
x_low, x_high: lower limit and upper limit of colored area
col: Name of color
Returns: Color plot between to particular plots with specified color.
set.seed(72500)
x <- rnorm(800)
dens_x <- density(x)
plot(dens_x)
x_low <- min(which(dens_x$x >= - 0.5))
x_high <- max(which(dens_x$x < 1))
with(dens_x,
polygon(x = c(x[c(x_low, x_low:x_high, x_high)]),
y = c(0, y[x_low:x_high], 0),
col = "darkgreen"))
|
Output:
Share your thoughts in the comments
Please Login to comment...