Pandas DataFrame quantile() Method | Find Quantile Values
Last Updated :
01 Feb, 2024
Python is a great language for data analysis, primarily because of the fantastic ecosystem of data-centric Python packages. Pandas is one of those packages, making importing and analyzing data much easier.
Pandas quantile() function returns values at the given quantile over the requested axis.
Note: In each of any set of values of a variate which divides a frequency distribution into equal groups, each containing the same fraction of the total population.
Example:
Python3
import pandas as pd
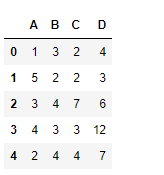
df = pd.DataFrame({"A":[1, 5, 3, 4, 2],
"B":[3, 2, 4, 3, 4],
"C":[2, 2, 7, 3, 4],
"D":[4, 3, 6, 12, 7]})
df
|
Output:
Syntax
Syntax: DataFrame.quantile(q=0.5, axis=0, numeric_only=True, interpolation=’linear’)
Parameters :
- q : float or array-like, default 0.5 (50% quantile). 0 <= q <= 1, the quantile(s) to compute
- axis : [{0, 1, ‘index’, ‘columns’} (default 0)] 0 or ‘index’ for row-wise, 1 or ‘columns’ for column-wise
- numeric_only : If False, the quantile of datetime and timedelta data will be computed as well
- interpolation : {‘linear’, ‘lower’, ‘higher’, ‘midpoint’, ‘nearest’}
Returns : quantiles : Series or DataFrame -> If q is an array, a DataFrame will be returned where the index is q, the columns are the columns of self, and the values are the quantiles. -> If q is a float, a Series will be returned where the index is the columns of self and the values are the quantiles.
Examples
Let’s see some examples of how to find values of a given quantile using the quantile() function of the Pandas library. Below are the Python codes that illustrates the working of the quantile method on a DataFrame with output.
Example 1
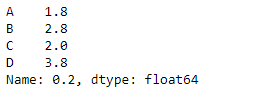
Let’s use the dataframe.quantile() function to find the quantile of ‘.2’ for each column in the DataFrame.
Python3
df.quantile(.2, axis = 0)
|
Output :
Example 2
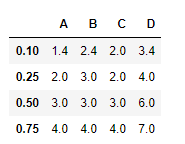
Use the quantile() function to find the (.1, .25, .5, .75) quantiles along the index axis.
Python3
import pandas as pd
df = pd.DataFrame({"A":[1, 5, 3, 4, 2],
"B":[3, 2, 4, 3, 4],
"C":[2, 2, 7, 3, 4],
"D":[4, 3, 6, 12, 7]})
df.quantile([.1, .25, .5, .75], axis = 0)
|
Output :
Share your thoughts in the comments
Please Login to comment...