How to Create a MIS Report in Excel – Quick Steps
- Collect data
- Input data into Excel
- Analyze using functions
- Design report layout
- Summarize insights
- Review and Save
Unlock the power of data-driven decision-making with Excel MIS reports! In this comprehensive guide, we’ll demystify the world of Management Information System (MIS) reports, explaining what they are and their various types. You’ll also gain valuable insights into the steps to create these reports effectively, helping you streamline your business processes, enhance efficiency, and make informed decisions. Join us on this journey into the realm of Excel MIS reports and harness the potential of organized, data-rich reporting for your success.
In this article, we will understand Management Information Systems i.e. MIS which is used in reporting jobs in daily business activities. we will also learn about making an MIS Report.

What is an MIS Report
MIS stands for Management Information System. It is an organised way of collecting data from various sources, compiling and presenting it in a readable form. Ultimately, generating reports which are used for day-to-day business activities. This is a feature in Excel where you can create on-demand reports. This allows users to generate an MIS report whenever they want.
Points to consider before creating an MIS report :
- Reports should have the right content
- Users need to know the history of business data to make decisions about the future.
- Make sure that the numbers add up and the dates or times are accurate.
- keeping it simple and well-structured so that everyone can easily understand.
Types Of MIS Reports
Types of MIS Reports
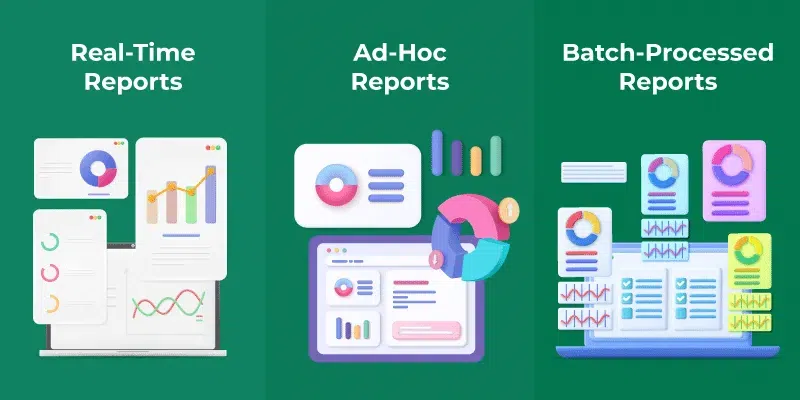
1. Real-Time Reports
This report is used if you want instant response to changes in data. This report reflects in real-time. They enable timely responses but may require robust data infrastructure and can be overwhelming with constant updates.
2. Ad-Hoc Reports
The term Ad-Hoc is used in contrast with Real-time Reporting. These types of reports are carried out when not relying entirely on real-time data.
3. Batch-Processed Reports
Batch-processed reports fall in between the Ad-Hoc and Real-Time Reporting systems. The reports are carried out on a pre-scheduled calendar of events.
Utilizing MIS Reports in Everyday Business
In our daily business operations, Management Information System (MIS) reports in Excel play a crucial role. Let’s explore some major industries that make use of these reports:
1. Financial Reporting
Financial reporting is vital for all organizations. It encompasses terms like project cash flow, revenue, and project costing, all falling under the umbrella of financial reporting.
These reports store, analyze, and present financial data through interactive dashboards, allowing project managers and business leaders to make real-time decisions.
2. HR Reporting
The Human Resources (HR) Information Management system focuses on employee data.
HR keeps tabs on employee hiring, termination, and performance data, enabling organizations to determine an employee’s value and make necessary decisions.
3. Sales Reporting
In sales reporting, organizations rely on their marketing and business analysts to study market trends, compare sales, and gain valuable insights.
MIS reports play a pivotal role in sales operations, aiding in decision-making.
4. Resource Reporting
MIS reporting supports resource management. It involves collecting data related to an organization’s resources and aligning them with predefined parameters to ensure smooth production operations.
Resources can include manpower, raw materials, and more.
5. Abnormality Reporting
Real-time MIS reporting includes abnormality reporting, which is essential for detecting sudden anomalies during peak business hours.
Abnormalities can take various forms, such as resource shortages, and these reports help address them promptly.
Why Should You Use an MIS Report
Using Management Information System (MIS) reports offers several advantages to businesses:
- MIS reports provide comprehensive data and insights, enabling informed and data-driven decision-making.
- MIS reports streamline data collection, analysis, and presentation processes, saving time and reducing the risk of errors associated with manual data handling.
- MIS reports allow you to track and monitor key performance indicators (KPIs) and metrics in real time.
- By analyzing historical data, MIS reports assist in forecasting future trends and planning for upcoming challenges or opportunities.
- MIS reports help in identifying areas where costs can be controlled and optimized, leading to better financial management.
- MIS reports provide insights into resource allocation, helping organizations allocate budgets, manpower, and assets more efficiently.
- Compliance and Regulation: MIS reports can help organizations ensure compliance with industry regulations and standards, minimizing the risk of legal and financial penalties.
- You can compare your organization’s performance with industry benchmarks and competitors, identifying areas where improvements are needed.
- MIS reports help to ensure that the organization’s activities align with its strategic objectives and goals.
- MIS reports facilitate clear and effective communication across different levels of an organization.
- With real-time data, organizations can respond more swiftly to emerging issues or opportunities, adapting strategies as needed.
- MIS reports can include data on customer behaviour and preferences, helping in customer relationship management and improving service.
- Analyzing data in MIS reports.
How does MIS Report Work and Why do you need it
MIS reports provide an accurate and precise idea of a company’s performance, including factors like revenue, customer demand, employee performance, cost of sales, etc. MIS reports collect this data relevant to business and transform it into a structured and understandable format. These reports provide key insights for planning and performance monitoring.
One can track the daily activities in the organization and improve the quality of products to increase customer acquisition. It allows you to determine trends and identify any underlying issues in your business.
Key Elements of MIS Reports
A Management Information System (MIS) comprises five crucial components:
People
This involves professionals across various departments who input data and transactions. It also includes executives who utilize MIS for decision-making. Support staff ensures smooth operation of software and hardware.
Data
Raw data from departments, such as sales figures, salaries, and bills, forms the foundation of MIS reporting. Accuracy in data is paramount.
Hardware
Hardware components encompass input and output devices used for data entry and display. These include keyboards, scanners, monitors, printers, and network devices.
Software
MIS relies on applications and computer programs, including spreadsheets, databases, and CRM software (Customer Relationship Management) to function effectively.
Business Procedures
Companies follow specific practices, which can vary. Different departments may establish unique business procedures within a company to align with their specific functions, scope, and objectives.
How to Create an MIS Report in Excel
The following steps explain the way to create an MIS Report :
Step 1: Open the Excel Sheet and Create a Table
Create a table with the required data in an Excel sheet
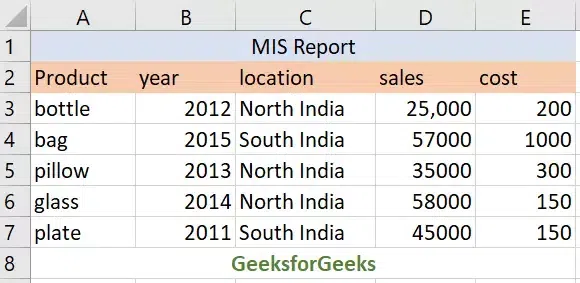
Create a Table
Step 2: Create a Pivot Table
Create a pivot table to organize data by clicking on the pivot table in the insert tab.

Step 3: Select the Location
Select the location in Excel where you want the table to appear. Here, we have selected the G2 column and also selected the whole table shown above in the below dialog box. Click on the Existing worksheet and select the column on the sheet to complete the step.

Select the Location
Step 4: Select all the Fields for the MIS Report
Now the pivot table field selects all the fields you want on the MIS report. Drag the fields to columns, filters, and rows appropriately.

Select all the Fields for the MIS Report
Step 5: Observe the Results
Observe the results on the sheet’s column you selected. It should look similar to the figure shown below.

Observe the Results
Step 6: Go to Insert Tab and Click on Pivot Chart
Click pivot charts on the tools bar to insert charts on the sheet. A dialog box like below appears after your click. Click on any of the charts you want. For instance, we can go for a clustered chart.
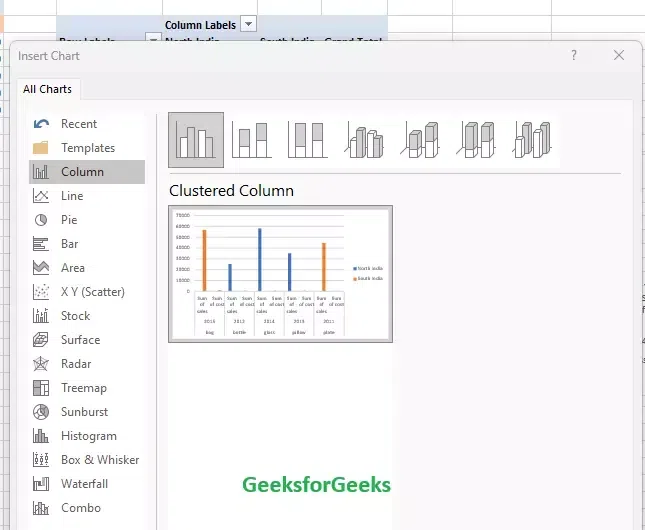
Click on Pivot Chart
Note: In the similar way you can select any type of chart you want from the given options like bar , line, Area, Pie, etc. We are showing below some examples of other charts for your better understanding.
Example 1:

Bar Chart
Example 2:
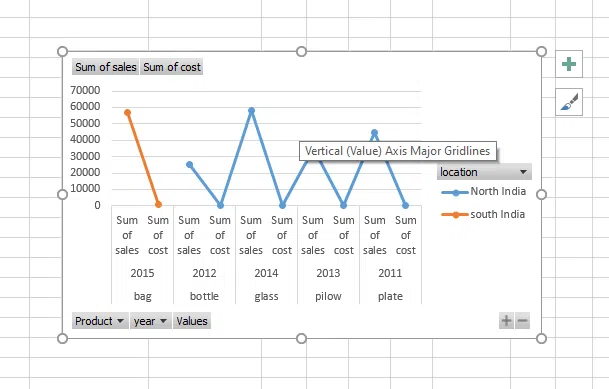
Line Chart
Example 3:

Pie Chart
Step 7: Select the Chart Type and Move Chart by Clicking on it
Move the charts to another sheet by clicking on charts and then move the charts to the analyze tab. A dialogue box is displayed where you mention the name of the new sheet and get the output.

Move the Chart by Clicking on it
Step 8: Preview the Result
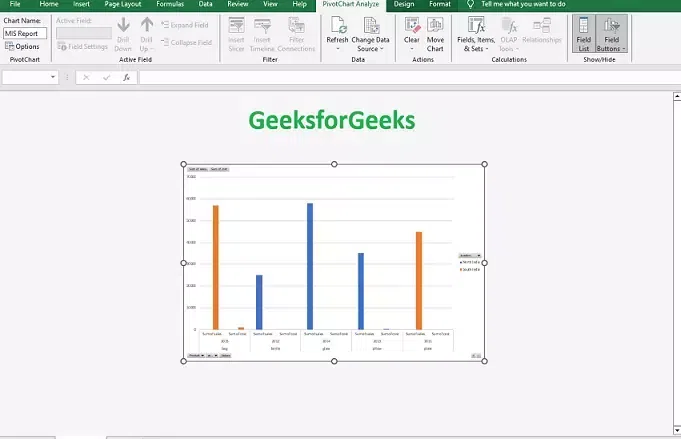
output
Conclusion
In this topic, we learned to use MIS Reports for making more optimal business representations. MIS reports are essential tools for informed decision-making, offering valuable insights into performance and operational efficiency, but their effectiveness depends on data accuracy, relevance, and clear presentation.
FAQs
Can I move multiple charts into other sheets ?
Yes , you can click on individual charts and move the other sheets one after other.
Can I import data from other multiple sources before creating pivot ?
Yes. you just have to select the source columns that you want to include in the target pivot table
What are the Components of MIS Reports ?
Components of MIS reports are :1. Data: Raw data collected from various sources.2. Information: Processed data that provides insights and context.3. Visualizations: Charts, graphs, and tables for easy comprehension.4. KPIs: Key Performance Indicators to measure success.5. Analysis: Interpretation and insights drawn from the data.6. Recommendations: Suggestions for action or improvement.7. Trends: Identification of patterns or trends in the data.8. Summary: A concise overview of the report’s findings.9. Security: Measures to protect sensitive information.10.Date and Source: Report date and data sources for reference.
What is the Importance of MIS Reports ?
MIS reports enable data-driven decision-making, fostering efficiency and strategic planning for organizations. They provide valuable insights for monitoring performance and optimizing operations.
What are the advantages and disadvantages of MIS Reports?
Advantages:1. Informed Decision-Making: MIS reports facilitate data-driven decisions.2. Efficiency: Streamlines data handling and improves resource management.Disadvantages:1. Costly Implementation: Setting up MIS systems can be expensive.2. Complexity: Complex data may lead to confusion if not presented well.
Share your thoughts in the comments
Please Login to comment...