Voting Classifier
Last Updated :
11 Oct, 2023
We can create prediction models using a variety of machine learning algorithms and approaches, which is an exciting subject. Scikit-Learn Voting Classifier is one such method that may dramatically improve the performance of your models.
An ensemble learning approach combines many base models to get a more effective and precise model. The theory behind this approach is that we may decrease bias and variation while also increasing performance by combining the predictions of many models.
Voting Classifier
A voting classifier is a machine learning model that gains experience by training on a collection of several models and forecasts an output (class) based on the class with the highest likelihood of becoming the output. To forecast the output class based on the largest majority of votes, it averages the results of each classifier provided into the voting classifier. The concept is to build a single model that learns from various models and predicts output based on their aggregate majority of votes for each output class, rather than building separate specialized models and determining the accuracy for each of them.
There are primarily two different types of voting classifiers:
- Hard Voting: In hard voting, the predicted output class is a class with the highest majority of votes, i.e., the class with the highest probability of being predicted by each classifier. For example, let’s say classifiers predicted the output classes as (Cat, Dog, Dog). As the classifiers predicted class “dog” a maximum number of times, we will proceed with Dog as our final prediction.
- Soft Voting: In this, the average probabilities of the classes determine which one will be the final prediction. For example, let’s say the probabilities of the class being a “dog” is (0.30, 0.47, 0.53) and a “cat” is (0.20, 0.32, 0.40). So, the average for a class dog is 0.4333, and the cat is 0.3067, from this, we can confirm our final prediction to be a dog as it has the highest average probability.
To properly use the Scikit-Learn Voting Classifier, take the following actions:
1) Import Libraries
Let us first import the necessary libraries that we will be using for our illustration.
Python3
import numpy as np
import warnings
from sklearn import datasets
from sklearn import model_selection
from sklearn.ensemble import RandomForestClassifier
from sklearn.ensemble import VotingClassifier
from sklearn.linear_model import LogisticRegression
from sklearn.naive_bayes import GaussianNB
from mlxtend.plotting import plot_decision_regions
import matplotlib.pyplot as plt
warnings.filterwarnings("ignore")
|
2) Load a Dataset
For our illustration purpose we will use the iris dataset from sklearn datasets.
Python3
iris = datasets.load_iris()
X, y = iris.data[:, 1:3], iris.target
|
3) Create Classifiers
First we will create different classifiers:
And then we will do the 5-fold cross validation on each of the above instantiated models to find the accuracy
Python3
clf1 = LogisticRegression(random_state=1)
clf2 = RandomForestClassifier(random_state=1)
clf3 = GaussianNB()
print('5-fold cross validation:\n')
labels = ['Logistic Regression', 'Random Forest', 'Naive Bayes']
for clf, label in zip([clf1, clf2, clf3], labels):
scores = model_selection.cross_val_score(clf, X, y,
cv=5,
scoring='accuracy')
print("Accuracy: %0.2f (+/- %0.2f) [%s]"
% (scores.mean(), scores.std(), label))
|
Output:
5-fold cross validation:

Accuracy: 0.95 (+/- 0.04) [Logistic Regression]
Accuracy: 0.94 (+/- 0.04) [Random Forest]
Accuracy: 0.91 (+/- 0.04) [Naive Bayes]
The result from the above output can be interpreted as:
1) Logistic Regression:
- Mean Accuracy: 0.95
- Standard Deviation: +/- 0.04
- Interpretation: The Logistic Regression model has a low standard deviation of 0.04 and average accuracy across the five folds of 95%. This shows that the model’s predictions are both accurate and consistent.
2) Random Forest:
- Mean Accuracy: 0.94
- Standard Deviation: +/- 0.04
- Interpretation: With a mean accuracy of 94% and a comparable standard deviation of 0.04, the Random Forest model likewise performed well. Although somewhat less accurate than Logistic Regression in this particular instance, it is still a strong model.
3) Naive Bayes:
- Mean Accuracy: 0.91
- Standard Deviation: +/- 0.04
- Interpretation: The Naive Bayes classifier has an accuracy of 91% on average, with a standard deviation of 0.04. It looks to be significantly less accurate than the other two models in this situation, but having decent accuracy.
4) Voting Classifier:
Hard Voting Classifier:
This classifier combines the predictions of individual classifiers using majority voting (hard voting).
Python3
voting_clf_hard = VotingClassifier(
estimators=[
(labels[0], clf1),
(labels[1], clf2),
(labels[2], clf3),
],
voting='hard'
)
|
Soft Voting Classifier:
This classifier combines the class probabilities of individual classifiers and selects the class with the highest probability (soft voting).
Python3
voting_clf_soft = VotingClassifier(
estimators=[
(labels[0], clf1),
(labels[1], clf2),
(labels[2], clf3),
],
voting='soft'
)
|
Comparing Voting Classifiers with Individual Classifiers
Now we will compare the results from Voting Classifiers with the 3 classifiers we defined at the start of this illustration
Python3
labels_new = ['Logistic Regression', 'Random Forest', 'Naive Bayes',
'Voting_Classifier_Hard', 'Voting_Classifier_Soft']
for clf, label in zip([clf1, clf2, clf3, voting_clf_hard, voting_clf_soft], labels_new):
scores = model_selection.cross_val_score(clf, X, y, cv=5, scoring='accuracy')
print("Accuracy: %0.2f (+/- %0.2f) [%s]"
% (scores.mean(), scores.std(), label))
|
Output:
Accuracy: 0.95 (+/- 0.04) [Logistic Regression]
Accuracy: 0.94 (+/- 0.04) [Random Forest]
Accuracy: 0.91 (+/- 0.04) [Naive Bayes]
Accuracy: 0.95 (+/- 0.04) [Voting_Classifier_Hard]
Accuracy: 0.95 (+/- 0.03) [Voting_Classifier_Soft]
The interpretation of the result is as follows:
1) Logistic Regression
- Mean Accuracy: 0.95
- Standard Deviation: +/- 0.04
- Interpretation: The Logistic Regression model has a minimal standard deviation of 0.04 and an average accuracy of 95%. It is accurate and reliable.
2) Random Forest
- Mean Accuracy: 0.94
- Standard Deviation: +/- 0.04
- Interpretation: The Random Forest model worked admirably, with a mean precision of 94% and a comparable standard deviation of 0.04. Although significantly less so than Logistic Regression, it is accurate and reliable.
3) Naïve Bayes
- Mean Accuracy: 0.91
- Standard Deviation: +/- 0.04
- Interpretation : The Naïve Bayes classifier has an accuracy of 91% on average, with a standard deviation of 0.04. Even though it is accurate, it is not quite as exact as the other models.
4) Voting Classifier (Hard Voting):
- Mean Accuracy: 0.95
- Standard Deviation: +/- 0.04
- Interpretation: The Hard Voting Classifier performed similarly well, achieving the same mean accuracy as Logistic Regression. Additionally, the standard deviation of 0.04 indicates consistency.
5) Voting Classifier (Soft Voting):
- Mean Accuracy: 0.95
- Standard Deviation: +/- 0.03
- Interpretation: Soft Voting has a standard deviation of 0.03 points and accurcy same as 95%. We can consider it as best classifiers.
Visualization of Classifiers
Now that we have already checked the result from all the voting classifier along with 3 other classifier. First, let us plot the decision boundaries of the first 3 classifiers.
Python
clf1 = LogisticRegression(random_state=1)
clf2 = RandomForestClassifier(random_state=1)
clf3 = GaussianNB()
clf1.fit(X,y)
clf2.fit(X,y)
clf3.fit(X,y)
classifiers = [clf1, clf2, clf3]
titles = ['Logistic Regression', 'Random Forest', 'Naive Bayes']
fig, axes = plt.subplots(1, 3, figsize=(10, 5))
plt.subplots_adjust(wspace=0.4, hspace=0.4)
for clf, title, ax in zip(classifiers, titles, axes.flatten()):
plot_decision_regions(X, y, clf=clf, ax=ax)
ax.set_title(title)
ax.set_axis_off()
plt.tight_layout()
plt.savefig('3 classifiers.png')
plt.show()
|
Output:
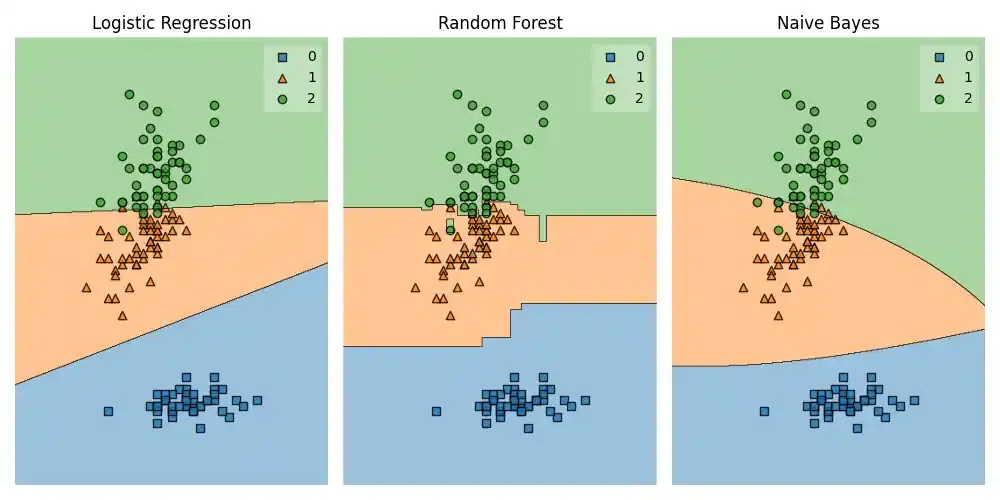
3 Classifiers Comparisions
And now we will plot the classifiers for Voting Classifier.
Python3
voting_clf_hard.fit(X,y)
voting_clf_soft.fit(X,y)
classifiers = [voting_clf_hard, voting_clf_soft]
titles = ['Hard Voting','Soft Voting']
fig, axes = plt.subplots(1, 2, figsize=(10, 5))
plt.subplots_adjust(wspace=0.4, hspace=0.4)
for clf, title, ax in zip(classifiers, titles, axes.flatten()):
plot_decision_regions(X, y, clf=clf, ax=ax)
ax.set_title(title)
ax.set_axis_off()
plt.tight_layout()
plt.savefig('voting.png')
plt.show()
|
Output:
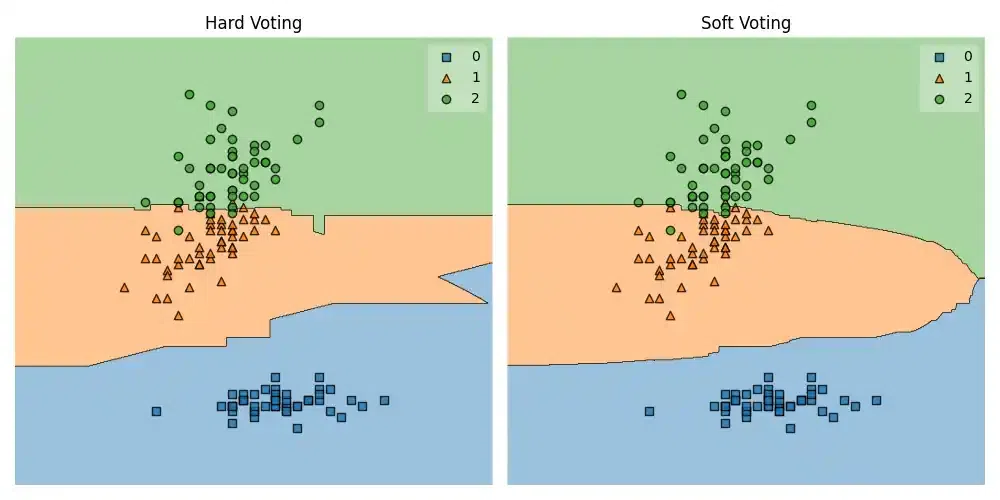
Voting Classifier
Examples:
- Classification tasks: When you have many powerful classifiers and wish to aggregate their predictions to improve accuracy, use a voting classifier.
- Model Selection: A Voting Classifier can assist in locating the best model when you are unclear of which one to use for your problem.
- Model Diversity: Combining models with various advantages and disadvantages, such as a decision tree, a support vector machine, and a neural network, can produce reliable results.
Share your thoughts in the comments
Please Login to comment...