Variability in R Programming
Last Updated :
05 Jul, 2023
Variability (also known as Statistical Dispersion) is another feature of descriptive statistics. Measures of central tendency and variability together comprise of descriptive statistics. Variability shows the spread of a data set around a point. Example: Suppose, there exist 2 data sets with the same mean value:
A = 4, 4, 5, 6, 6 Mean(A) = 5 B = 1, 1, 5, 9, 9 Mean(B) = 5
So, to differentiate among the two data sets, R offers various measures of variability.
Measures of Variability
Following are some of the measures of variability that R offers to differentiate between data sets:
Variance
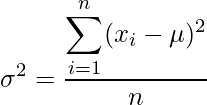
Variance is a measure that shows how far each value is from a particular point, preferably the mean value. Mathematically, it is defined as the average of squared differences from the mean value. Formula:  where,
 specifies variance of the data set
  specifies
  value in data set
  specifies the mean of data set n specifies total number of observations
In the R language, there is a standard built-in function to calculate the variance of a data set.
Syntax: var(x) Parameter: x: It is data vector
Example:
R
x <- c(5, 5, 8, 12, 15, 16)
print(var(x))
|
Output:
[1] 23.76667
Standard Deviation
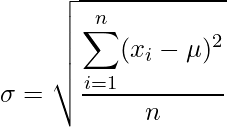
Standard deviation in statistics measures the spreadness of data values with respect to mean and mathematically, is calculated as square root of variance. Formula:  where,
 specifies standard deviation of the data set
  specifies
  value in data set
  specifies the mean of data set n specifies total number of observations
In R language, there is no standard built-in function to calculate the standard deviation of a data set. So, modifying the code to find the standard deviation of data set. Example:
R
x <- c(5, 5, 8, 12, 15, 16)
d <- sqrt(var(x))
print(d)
|
Output:
[1] 4.875107
Range
Range is the difference between the maximum and minimum value of a data set. In R language, max() and min() is used to find the same, unlike range() function that returns the minimum and maximum value of the data set.
Example:
R
x <- c(5, 5, 8, 12, 15, 16)
print(range(x))
print(max(x)-min(x))
|
Output:
[1]  5 16
[1] 11
Mean Deviation
Mean deviation is a measure calculated by taking an average of the arithmetic mean of the absolute difference of each value from the central value. Central value can be mean, median, or mode. Formula:  where,
 specifies
  value in data set
  specifies the mean of data set n specifies total number of observations
In R language, there is no standard built-in function to calculate mean deviation. So, modifying the code to find the mean deviation of the data set.
Example:
R
x <- c(5, 5, 8, 12, 15, 16)
md <- sum(abs(x-mean(x)))/length(x)
print(md)
|
Output:
[1] 4.166667
Interquartile Range
Interquartile Range is based on splitting a data set into parts called as quartiles. There are 3 quartile values (Q1, Q2, Q3) that divide the whole data set into 4 equal parts. Q2 specifies the median of the whole data set. Mathematically, the interquartile range is depicted as:
IQR = Q3 – Q1
where,
Q3 specifies the median of n largest values Q1 specifies the median of n smallest values
In R language, there is a built-in function to calculate the interquartile range of data set.
Syntax: IQR(x) Parameter: x: It specifies the data set
Example:
R
x <- c(5, 5, 8, 12, 15, 16)
print(IQR(x))
|
Output:
[1] 8.5
Share your thoughts in the comments
Please Login to comment...