Python has a special arithmetic function called the “Stair Step Function” that behaves like steps on a staircase. It assigns constant values to the specific intervals of its domain, resulting in a step-like graph. People also call these functions “piecewise constant functions” or “step functions”. Mathematics and programming have various uses, such as processing signals or analyzing data. In this article, we will explore in depth about step function in Python.
Stair Step Function
A stair step function in Python is a piecewise-defined mathematical function, represented as f(x), which assigns constant values within distinct intervals or segments, or steps, of its input domain, typically denoted as x. The function exhibits a discrete, stepwise pattern when graphed, resembling a staircase. Stair-step functions can be explicitly defined by specifying fixed values for each interval, or they may be algorithmically generated based on predetermined conditions or rules. Stair-step functions can be used to model a wide range of phenomena.
This type of function is commonly used in various fields such as engineering, economics, and computer science to model systems with discrete states or to approximate continuous functions.
The general form of a stair step function can be expressed as:

Where c1, c2, …, cn are constant values and a, b, …, n are the boundaries of the intervals. The function takes on the value of ci within the interval (ai, bi] for i = 1, 2, …, n.
A step function is a function f(x) that satisfies the following conditions:
- f(x) is a constant value ci on the interval [ai,bi], where ai<bi for all i.
- f(x) jumps from ci to ci+1 at the point bi.
Stair step functions have the following properties:
- They are piecewise constant.
- They are discontinuous at the endpoints of the intervals.
- They have a finite number of steps.
- The height of each step is determined by the constant value of the function on the interval.
Types of Step Functions
Here are some examples of step functions:
1. Unit Step Function
The unit step function is defined as 1 for x > 0 and 0 for x <= 0.

Unit step function
This function can be used to represent a sudden change in state, such as the turning on or off of a light switch. The unit step function is also known as the Heaviside step function. The graph of the unit step function is a straight line that jumps from 0 to 1 at x = 0.
2. Heaviside Step Function
The Heaviside step function is defined as 1 for x >= 0 and 0 for x < 0.

Heaviside Step Function
It is also known as the unit step function. The Heaviside step function is named after Oliver Heaviside, who used it to represent the sudden change in voltage that occurs when a switch is turned on. The graph of the Heaviside step function is a straight line that jumps from 0 to 1 at x = 0.
3. Floor Function
The floor function returns the largest integer less than or equal to x.

Floor Function
For example, floor(3.14) = 3, floor(-2.5) = -3, and floor(0) = 0. The graph of the floor function is a staircase function that jumps down by 1 at each integer value of x.
4. Ceiling Function
The ceiling function returns the smallest integer greater than or equal to x.

Ceiling Function
For example, ceil(3.14) = 4, ceil(-2.5) = -2, and ceil(0) = 0. The graph of the ceiling function is a staircase function that jumps up by 1 at each integer value of x.
5. Ramp Function
The ramp function is defined as x for x >= 0 and 0 for x < 0.

Ramp function
This function can be used to represent a smooth transition from one state to another, such as the dimming of a light bulb. The graph of the ramp function is a straight line that starts at 0 and increases linearly with x for x >= 0.
Related terms to Stair Step Function
Several concepts are related to stair step functions, and understanding these concepts can help you work with them effectively:
- Piecewise Functions: A piecewise function in Python is a mathematical function that is defined in separate “pieces” or segments, each with its own distinct formula or behavior. These segments are defined based on specific conditions or intervals. A step stair function is a type of piecewise function that consists of horizontal line segments, where the function remains constant within each interval, creating a stair-like appearance. In Python, you can define piecewise functions using conditional statements and combine them to create step stair functions, making it a useful approach for modeling functions with different behaviors in various regions or intervals.
- Step Size: “Step size” is a parameter used in connection with a step or step function to control the size of each step or interval when executing a sequence of measurements and to distinguish between successive measurements within the sequence. For example, if you use a step size of 2 in a range function to create a sequence, you will get values like 0, 2, 4, 6, where the distance between each step is 2 units If you change the step size , it can be a series of specific increments or intervals, so that repetition or data-shifting etc. can be avoided. It is a useful tool for programming projects
- Discontinuity: “Discontinuity” refers to a sudden change or jump in the function’s values at specific points, creating visible gaps or breaks in the graph of the function. These points are typically where the function transitions from one constant value to another. Discontinuities can occur in step functions when abrupt shifts take place, such as when switching between different levels or states in the function’s output. Understanding and handling these discontinuities is essential for accurately modeling and analyzing step functions in Python.
- Thresholds: A threshold refers to a value that separates two different states or actions. When the input crosses this threshold, the function switches between one state or action to another. For example, in a step function, when the input value is less than the threshold, it outputs one value, and when the input value is greater than or equal to the threshold, it outputs a different value. Thresholds are commonly used for decision-making and control logic in various applications, like sensor data processing or binary classification.
- Interpolation: Interpolation involves estimating intermediate values between discrete steps. A step stair function is a piecewise constant function with abrupt changes at specific points. Interpolation techniques, such as linear interpolation, help to approximate values at non-discrete points within the step intervals. This is useful for creating smoother visual representations or making stepwise data more continuous and practical for analysis or visualization in Python.
- Signal Processing:Signal processing refers to the manipulation and analysis of data in the form of signals, which represent variations over time. A step or stair function is a fundamental type of signal characterized by abrupt changes at specific time points, often resembling a staircase-like pattern. NumPy and SciPy are used to process step functions, performing tasks like filtering, convolution, or Fourier analysis. This enables you to extract insights, modify signals, or apply specific techniques to address various applications in engineering, science, and technology.
Stair Step Function Implementations
Example: 1
Here’s an example of a simple stair step function in Python that assigns different constant values to specific intervals:
Python
def stair_step_function(x):
if x < 0:
return 0
elif 0 <= x < 2:
return 1
elif 2 <= x < 4:
return 2
else:
return 3
x_values = [-1, 1, 2.5, 4, 5]
for x in x_values:
result = stair_step_function(x)
print("For x =",x,"the function value is",result)
|
Output:
For x = -1 the function value is 0
For x = 1 the function value is 1
For x = 2.5 the function value is 2
For x = 4 the function value is 3
For x = 5 the function value is 3
Explanation:
- When x is -1, it’s less than 0, so the function returns 0.
- When x is 1, it falls within the interval [0, 2), so the function returns 1.
- When x is 2.5, it’s in the interval [2, 4), so the function returns 2.
- When x is 4 or 5, it’s greater than or equal to 4, so the function returns 3.
To plot the graph of the given stair_step_function, you can use the matplotlib library in Python. If you don’t have it installed, you can do so using pip install matplotlib. Here’s the code to plot the graph:
Python
import numpy as np
import matplotlib.pyplot as plt
def stair_step_function(x):
if x < 0:
return 0
elif 0 <= x < 2:
return 1
elif 2 <= x < 4:
return 2
else:
return 3
x_values = np.linspace(-1, 5, 1000)
y_values = [stair_step_function(x) for x in x_values]
plt.plot(x_values, y_values, label="Stair Step Function", linewidth=2)
plt.xlabel("x")
plt.ylabel("f(x)")
plt.title("Stair Step Function")
plt.grid(True)
plt.legend()
plt.show()
|
Output:

This graph represents the stair step function, where the function value changes abruptly at the specified intervals. The steps in the graph correspond to the values returned by the function for different values of x.
Example 2
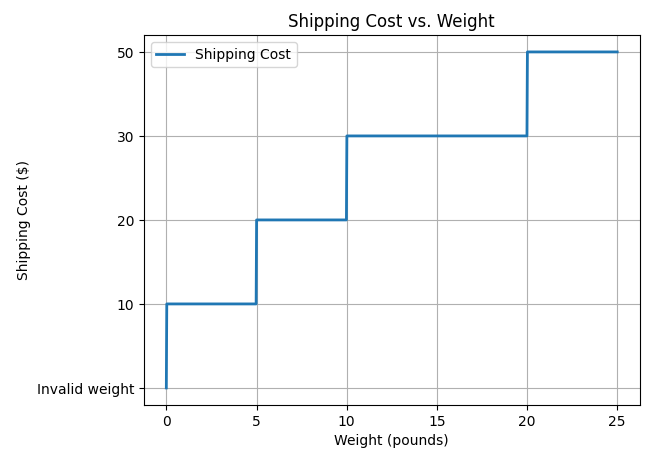
Another real-life example related to a shipping cost calculation, where the cost varies based on the weight of a package. Lets create a stair step function to determine the shipping cost for different weight intervals.
Python
def shipping_cost(weight):
if weight <= 0:
return "Invalid weight"
elif weight <= 5:
return 10
elif weight <= 10:
return 20
elif weight <= 20:
return 30
else:
return 50
weights = [2, 7, 15, 25]
for weight in weights:
cost = shipping_cost(weight)
print("For a package weighing",weight,"pounds, the shipping cost is $",cost)
|
Output:
For a package weighing 2 pounds, the shipping cost is $ 10
For a package weighing 7 pounds, the shipping cost is $ 20
For a package weighing 15 pounds, the shipping cost is $ 30
For a package weighing 25 pounds, the shipping cost is $ 50
In this example, the shipping_cost function takes the weight of a package as input and calculates the shipping cost based on different weight intervals. The cost increases in steps, with specific price points for packages of 5 pounds or less, 10 pounds or less, and 20 pounds or less. For packages over 20 pounds, the cost remains constant at $50. This is a practical application of a stair step function, where the shipping cost changes in discrete steps based on the weight of the package.
Here’s the code to plot the graph:
Python
import numpy as np
import matplotlib.pyplot as plt
def shipping_cost(weight):
if weight <= 0:
return "Invalid weight"
elif weight <= 5:
return 10
elif weight <= 10:
return 20
elif weight <= 20:
return 30
else:
return 50
weights = np.linspace(0, 25, 1000)
costs = [shipping_cost(weight) for weight in weights]
plt.plot(weights, costs, label="Shipping Cost", linewidth=2)
plt.xlabel("Weight (pounds)")
plt.ylabel("Shipping Cost ($)")
plt.title("Shipping Cost vs. Weight")
plt.grid(True)
plt.legend()
plt.show()
|
Output:
Frequently Asked Questions
1.What is a stair step function in Python?
A stair step function in Python is a mathematical function that assigns constant values over specific intervals of its input domain, creating a stepwise or staircase-like pattern when graphed. These functions are used in various mathematical and programming contexts to model data with abrupt changes.
2.How can I define a stair step function in Python?
Stair step functions can be defined in Python using conditional statements (if-elif-else) to specify constant values for different intervals of the input variable. For example, you can use a series of if and elif statements to define the function’s behavior within each interval.
3.What are the key characteristics of stair step functions?
Stair step functions are characterized by abrupt changes or discontinuities at specific threshold points. They consist of piecewise constant values within defined intervals.
4.How can I visualize a stair step function in Python?
We can use graphing libraries like matplotlib to create plots and graphs that visualize the behavior of stair step functions. These plots show the intervals, thresholds, and step-like pattern.
5.What is the significance of step size in stair step functions?
The step size represents the change in the function’s value as you move from one interval to the next. It determines the increment or decrement when crossing the boundary between intervals.
Share your thoughts in the comments
Please Login to comment...