Setting Up Your First Managed Grafana Instance On Azure
Last Updated :
15 Mar, 2024
Monitoring and observation are crucial parts of modern application creation and launch. As the systems become more complex, and adopt a distributed approach to function, the visibility of the performance and health of these systems is required at a comprehensive level. With the emergence of Grafana, an open-source analytics and monitoring solution, there is now one powerful tool that can be used for insight into data from many origins. While Grafana presents inconveniences in setting up and administration, even in a competitive environment, they are beyond the expectations of individuals.
This complicated task can be achieved more easily if people are simply using Azure Managed Grafana, as it is a fully managed Grafana service hosted within the Azure cloud. This strategy saves a client from incurring the ramifications of procuring, configuring, and running Grafana servers. Consequently, the client can concentrate on using the capacity provided to assess software applications and infrastructure.
In this article, we’ll take you from concept to completion and lead you through all the steps to set up your first managed Grafana instance on Azure. We will cover the basics before dealing with the installation, configuring the environment, and the initial steps to circulate it to you. Once we are done with this article, you will grasp how to have a managed Grafana constructed, and you can immediately make connections with many data sources to discover and analyze your data.
What is Grafana?
Grafana, being an open-source data visualization and monitoring platform for us, enables us to form any data visualization and dashboard over different data sources. It brings a highly potent and versatile set of features that enable monitoring and analysis of applications, databases, and servers as well as other metrics, logs, etc.
Here are some key points about Grafana:
- Dashboards and Visualizations: The key functionality of Grafana is the ability to create data visualizations (for example, graphs, charts, tables, and so on) that are flexible and responsive to the user’s interaction in the form of dashboards. These spatio-temporal viewing tools can be re-formatted to match your respective monitoring and analysis goals.
- Data Source Integration: Grafana works with various data sources like Prometheus, InfluxDB, Elasticsearch, PostgreSQL, and MySQL that pertain to common databases, cloud monitoring services which include Cloudwatch, Azure Monitor, Google Cloud Monitoring and others can also be integrated via plugins.
- Alerting: By this means, Grafana makes it possible for you to have rules for alerting based on your data sources. Such notifications can be configured to occur via email, Slack, PagerDuty, or others when conditions match the parameters.
- Annotations: You can even enhance your graph with a notepad where you can write your notices about events that correspond to metric fluctuations, thus making it easier to pinpoint and isolate problems.
- Plugins and Customization: Of note, Grafana boasts an active community that expands its plugin availability. For instance, libraries can add new kind of data, visualization type, search method and more.
- Access Control: Grafana will provide you with the ability to manage the access rights to dashboards, folders, and data sources by defining user roles and the corresponding permissions.
It turns out that Grafana is much more than a single monitoring solution. It is used in many different industries and scenarios. This includes, for example, DevOps, infrastructure monitoring, application performance monitoring, IoT, and business intelligence. Its flexibility and multiple data sources help make it one of the options that people can go for in an attempt to be with a centralized monitoring and analytics solution.
What is Managed Grafana Instance on Azure?
An Azure Managed Grafana Instance is a completely managed service by Microsoft where Grafana, an open-source graph monitoring and data visualization platform, is run and managed in the Azure cloud.
Here are the key features and benefits of using a Managed Grafana Instance on Azure:
- Fully Managed Service: Microsoft handles the deployment, configuration, patching, and scaling of your Grafana instances, hence, relieving you from the compatibility and size factor management tasks.
- High Availability: Management of business Grafana Instances is done in a highly available configuration which will make the uptime more efficient and stronger for data visualization and monitoring purposes.
- Scalability: Due to the elasticity of the Managed Grafana Instance, you can freely scale it up or down anytime based on your appetite, and it will adjust automatically to the existing workload.
- Integration with Azure Services: You can use Managed Grafana Instances to easily adopt integrations with other Azure services such as Azure Monitor, Azure Data Explorer, or Azure Log Analytics, then bring different types of Azure resources together for better visualization and monitoring.
- Security and Compliance: Azure Managed Grafana Instances reside within the Azure infrastructure, and hence they only have access to a virtual private cloud (VPC) with similar security features like Azure Active Directory, Dynamic Threat Protection and network isolation. However, the instances can access services like Azure Active Directory, Dynamic Threat Protection and network isolation.
- Cost Optimization: While with the managed Grafana service you just pay for the resources that have been used, rather than for those that have been set up, thus no need to host your own infrastructure for running Grafana.
- Streamlined Updates: Let Microsoft Managed Grafana Instances save you time through automation. We handle all updates and upgrades, guaranteeing access to the newest features and patches as they become available so you can remain focus on to your graphic visualizations.
- Access Control and Authentication: Grafana Managed Instances enables Azure Active Directory (Azure AD) integration allows you to utilize your existing Azure AD identities for authentication as well as for access control.
Through a Take-Managed Condition Grafana Instance may be run in Azure,
How to Setup Your First Managed Grafana Instance on Azure?
Here’s a step-by-step guide to setting up your first Managed Grafana Instance on Azure:
Sign in to the Azure Portal
- Go to the Access of the Azure Portal at https://portal.azure.com and sign in with your Azure account credentials.
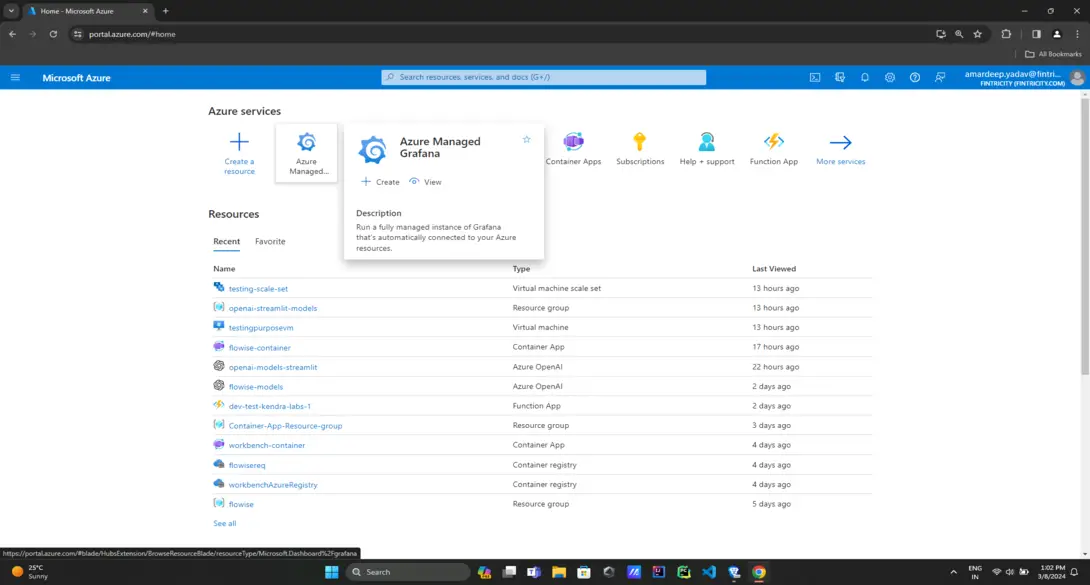
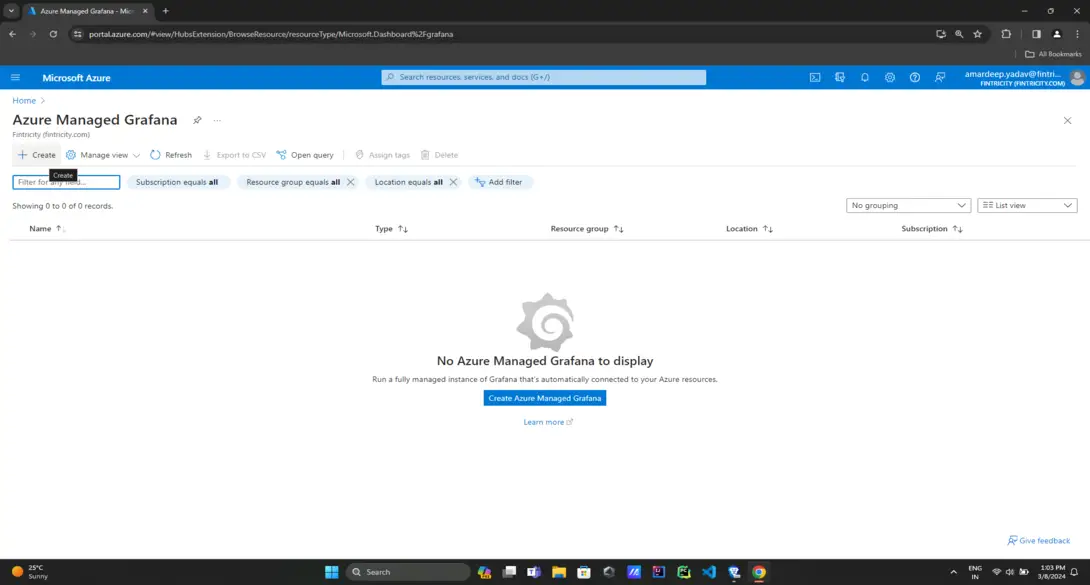
- Create a Managed Grafana Instance on azure portal that you have just opened.
- In the Azure Portal, search for “Managed Grafana” in the search bar, and select “Managed Grafana” from the results. as shown below in the image.
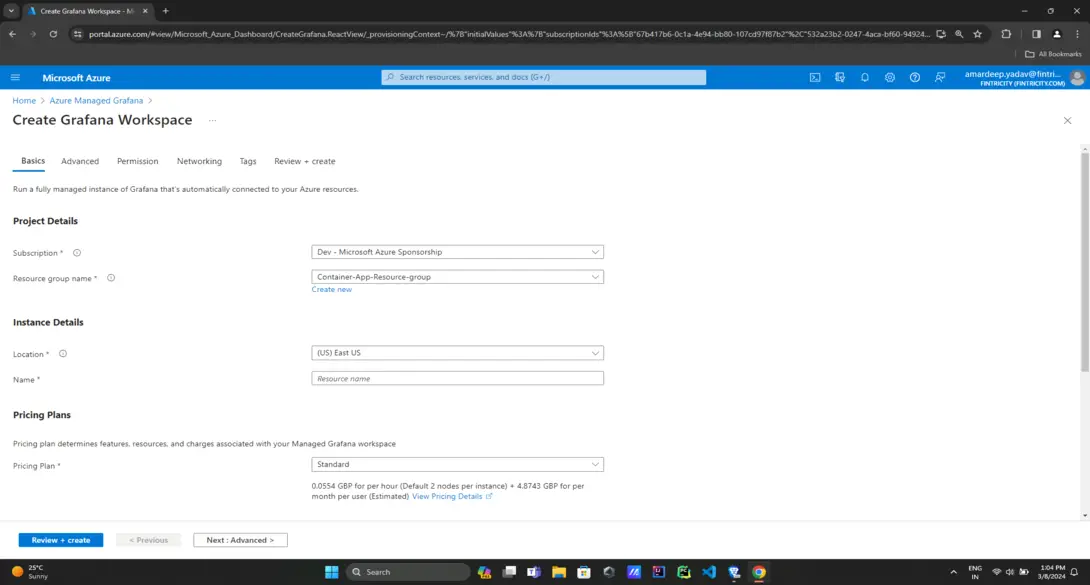
Configure Basic Settings
- Select the appropriate Subscription and Resource Group for your Managed Grafana Instance. These can be according to your conditions and circumstances
- give a unique Name for your instance.
- Choose the desired Region where you want to host your Managed Grafana Instance.
Configure Managed Instance Settings
- Select the appropriate Pricing Tier based on your requirements (e.g., 8 vCPU, 16 vCPU). Do this according to your load, can be adjusted in further testing after deployment.
- Choose the desired Virtual Network and Subnet for your Managed Grafana Instance. This is done for the access management of Grafana.
- Configure the Grafana Admin User name and password.
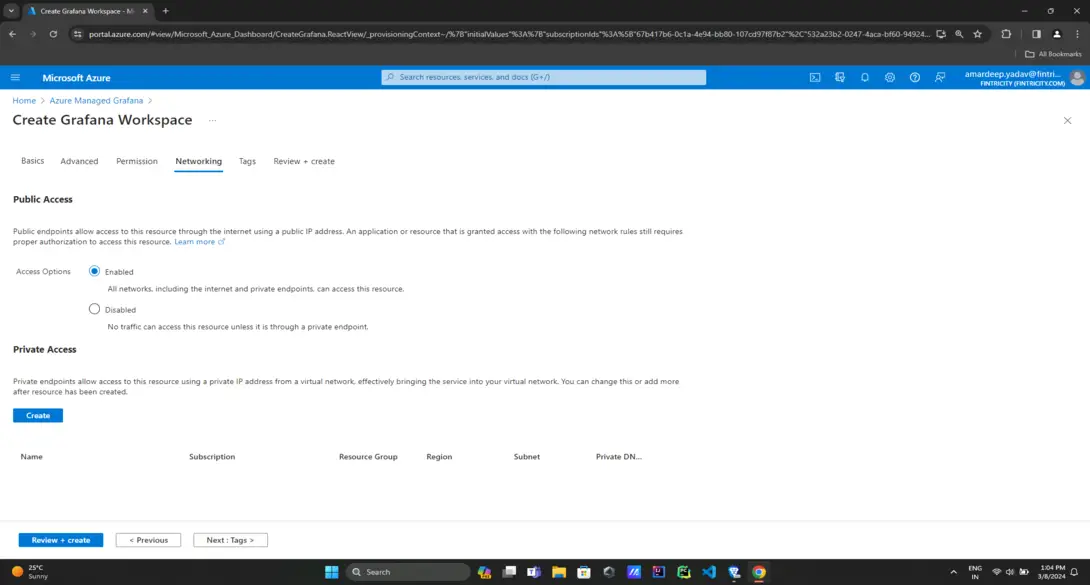
Configure Advanced Settings (Optional)
- If needed, configure advanced settings such as Diagnostics, Networking, and Monitoring.
- Enable Azure Monitor integration to send metrics and logs to Azure Monitor.
- Set up Azure AD Authentication for secure access control. This part of security is essential to prevent the hacking.
Review and Create
- Review the configuration settings and ensure everything is correct.
- Click the “Create” button to start the deployment process.
Wait for Deployment
- The deployment process may take several minutes to complete.
- You can monitor the progress in the Azure Portal notifications.
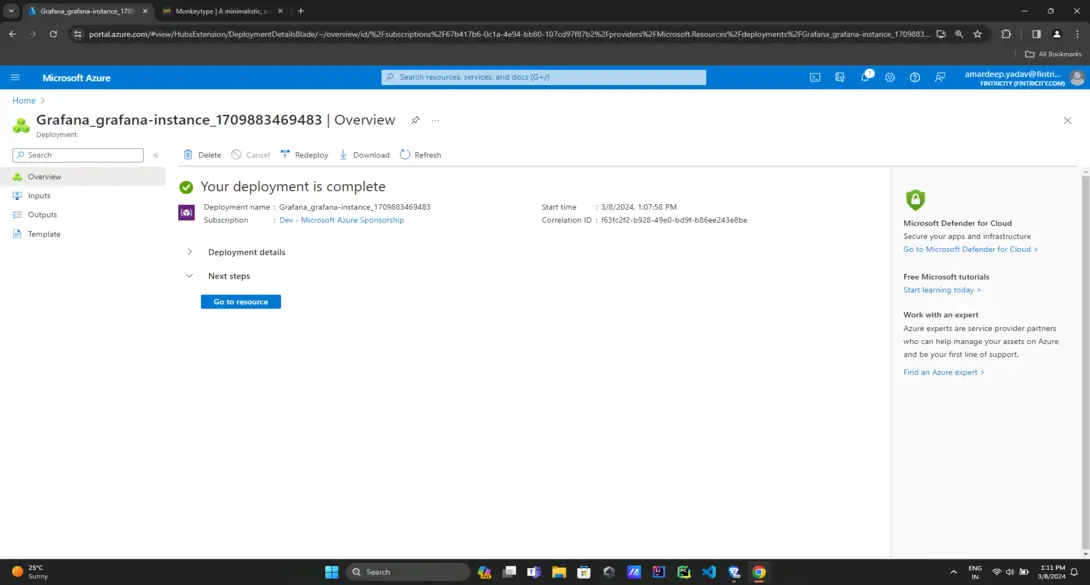
Access Your Managed Grafana Instance
- Once the deployment is complete, go to the “Overview” section of your Managed Grafana Instance.
- Copy the Managed Grafana URL, which will be in the format https://<instance-name>.grafana.cloudapp.azure.com.
- Open the URL in a web browser, and you’ll be prompted to log in with the Grafana Admin User credentials you configured earlier.
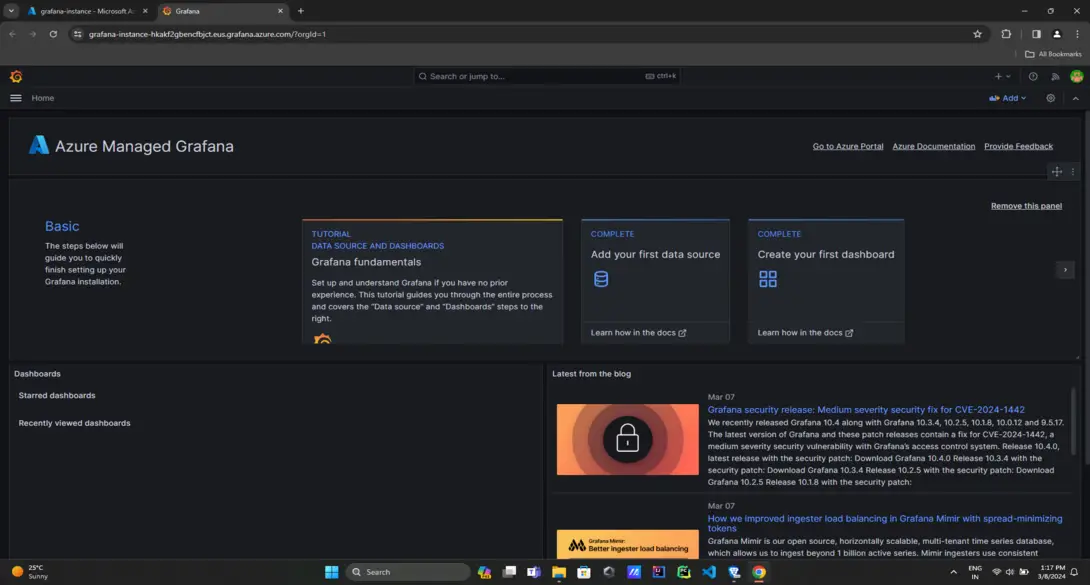
Configure Data Sources
- In the Grafana UI, navigate to the “Configuration” section and click on “Data Sources.”
- Add the desired data sources (e.g., Azure Monitor, Prometheus, InfluxDB) by providing the necessary connection details.
Create Dashboards and Visualizations
- With your data sources configured, you can now start creating dashboards and visualizations to monitor and analyze your data.
- Explore the various visualization options and customization features provided by Grafana.
Integrate with Azure Services (Optional)
- If desired, you can integrate your Managed Grafana Instance with other Azure services like Azure Monitor, Azure Data Explorer, or Azure Log Analytics for comprehensive monitoring and analysis.
Manage and Scale
- As your monitoring needs grow, you can easily scale your Managed Grafana Instance by adjusting the compute resources in the Azure Portal.
- Manage access control, update configurations, and monitor usage and costs directly from the Azure Portal.
By following these steps, you’ll have your first Managed Grafana Instance up and running on Azure, ready to provide powerful data visualization and monitoring capabilities for your applications and infrastructure.
Advantages of a Managed Grafana Instance on Azure
- Fully Managed Service: Azure takes care of the deployment, configuration, hosting, and autoscaling of Grafana instances, meaning that you don’t need to spend your time and resources to manage the infra alone.
- High Availability: Activated Grafana managed Instances are maintained in a highly-available structure, allowing for greater availability and robustness in addresssing the problems of your monitoring and data visualization.
- Scalability: With an elastic Managed Grafana Instance, you can do scaling, by choosing the amount of the compute resources which you want it to automatically adjust, to be scaled accordingly to your workload requirements.
- Integration with Azure Services: Managed Grafana Instances can be easily set up with other Azure services, such as Azure Monitor, Azure Data Explorer, and Azure Log Analytics. They will then create various visualization and monitoring othe data from different Azure resources.
- Security and Compliance: Managed Grafana Instances using Azure hosting platform scores with its security attributes derived from Azure hybrid cloud infrastructure including network isolation, encryption and certification standards (e.g., ISO, SOC, PCI DSS).
- Cost Optimization: Managed service is basically a service which is based on pay per use and in the same way you do not have to be provisioned or maintained for running Grafana on dedicated infrastructure.
- Streamlined Updates: One of the key draws of the Managed Grafana Instances provided by Microsoft is the fact that they take care of all the updates and upgrades, which include features and security patches. Consequently, you utilize the latest version always without having to update it manually.
- Access Control and Authentication: The Managed Grafana Instances of this service can be integrated with Azure Active Directory (Azure AD), which enables you to use your existing Azure AD identities from authentication and access control processes.
Disadvantages of a Managed Grafana Instance on Azure
- Vendor Lock-in: With this environment extension of the Azure, you submit yourself to the Azure platform, which may not be your case given that you might have a multi-cloud and on-premise strategy.
- Limited Customization: Azure offers a managed service, however, it might cause customers to limit the opportunity to customize the Grafana configuration or use third-party plugins which is partially the unbeatable benefit of self-hosting Grafana.
- Cost: Calculating the costs for Managed Grafana Instance on Azure becomes a relevant concern, particularly to organizations which will experience higher expenses than self-hosting Grafana on their own infrastructure.
- Learning Curve: If your team or you are new to Azure and hence different services it may be a chore for you to get used with setting up and supervising a managed Grafana instance within the Azure land.
- Outage Risk: Although Azure offers high availability, there is the risk of downtime or any unforeseen anomaly that is beyond your control which might affect your monitoring and data visualization capacities.
- Data Transfer Costs: If you are planning to move a big chunk of data from on-premises or other cloud machines to Managed Grafana Instance, then additional cost of data transfer will be incurred, which is why make sure that your application does not generate excessive amount of traffic.
Conclusion
Totally speaking as someone who did work on setting up a Managed Grafana Instance on Azure, I have to say, that it is manageably good for everyone who wants to simplify their monitoring and visualization services. Man, there may be some difficulties to overcome if the Azure environment is all new to you, but it’s the rewards you receive that win in the end. Another of the most amazing things I discovered was that I had neither to spend time and resources on configuring and maintaining the Grafana infrastructure because Azure had all jobs under control. No more worrying about patching, scaling, or ensuring high availability – Azure takes care of all that for you, allowing you to focus on what really matters: the use of dashboards and visualizations. Also included are the capabilities to extend Managed Grafana to other services in the Azure platform including Azure monitor and Azure Data explorer among others. All of the sudden, the most convenient place where you can control using commands, monitor all the data from your Azure services, and analyze it, is one-stop daily routine for your cloud solutions for easy trend finding, issues detection, and making sane decisions.
Managed Grafana Instance on Azure – FAQ’s
What is the difference between a Managed Grafana Instance and self-hosted Grafana?
A Managed Grafana Instance is a fully managed service provided by Microsoft, where Azure handles the deployment, configuration, patching, and scaling of the Grafana instances. With self-hosted Grafana, you are responsible for managing the infrastructure and maintenance yourself.
Can I integrate my Managed Grafana Instance with other Azure services?
Yes, Managed Grafana Instances can seamlessly integrate with various Azure services like Azure Monitor, Azure Data Explorer, and Azure Log Analytics, allowing you to visualize and monitor data from these sources.
How do I control access to my Managed Grafana Instance?
Managed Grafana Instances support Azure Active Directory (Azure AD) integration, allowing you to leverage your existing Azure AD identities for authentication and access control. You can manage user roles and permissions within the Grafana instance.
Can I customize my Managed Grafana Instance?
While Microsoft handles the underlying infrastructure and core configuration, you can still customize your Managed Grafana Instance by adding data sources, creating dashboards and visualizations, and configuring alerts and notifications.
How do I scale my Managed Grafana Instance?
You can easily scale your Managed Grafana Instance up or down based on your requirements by adjusting the compute resources in the Azure Portal. Azure will automatically handle the scaling process, ensuring your instance has the necessary resources to meet your workload.
Share your thoughts in the comments
Please Login to comment...